There is an easy option that is fair to everyone, avoids sacrificing some areas and retains fish sizes.
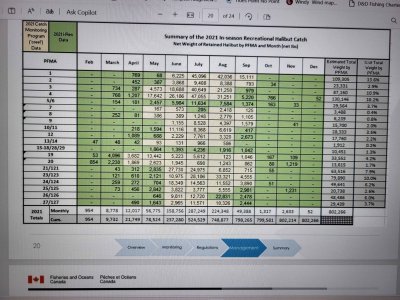
A flat rate halibut catch reduction of 15% of total season catch ratio for each and every area. The catch ratio number for each area is clearly documented by DFO to determine when we hit our yearly quota, (See attached) so it is easy to see which month that lbs of fish are being caught.
Two major areas represent 70.3% of the lb and catch ratios of the total catch for all of the West Coast.
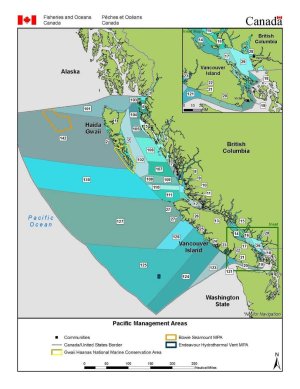
Haida Gwaii/Prince Rupert areas (1, 2, 3, 4, 5/6) catch 379,516lb which represents 47.6% of the total catch.
The Central West Coast of Vancouver Island (121,123,124,125,126) are catching 262,271 or 22.7% of the total catch.
They account for 641,787lb or 70.3 % of the total catch for all of the West Coast.
If the total catch is to be reduced by 15%, all areas should suffer by the same 15% catch reduction. It would be easy for DFO to set new opening and closure dates for each area, the same way they do for salmon. Each area would have to decide which months they will be closed for halibut fishing and that would be based on monthly catch ratios. It is easy to see and calculate the 15% for each area. Each area should close months or some days to meet the 15% reduction. Everyone will have to sacrifice a few shoulder months but be allowed to keep their most productive months.
Everyone will have to close a few months in their season to meet the 15% catch reduction numbers. But the fish will remain the same slots limit size.
I don’t have the 2023/2024 years catch numbers, so my modeling is from the catch ratio numbers from 2021 (attached) where the total take was 802,266lb. If each area were to shut down during a few shoulder months of their halibut opening, they will meet their 15% reduction of their total catch. Everyone would then suffer the same in loss to meet their 15% reduction in total catch.
Here is just a few examples of how the 15% reduction and closures would work.
Area 4 catche is 130,146lb per yr (16.2%) of total halibut caught) and a 15% reduction would be 19,522lb.
If they shut down Jan, Feb, March 786lb + April 1,207lb + May 17,642lb = 19,635lb. They would meet their 15% reduction.
Halibut fish is only open June, July, Aug, Sept which are their higher catch ratio months.
These closures would also apply to bordering areas such as 1, 2, 3, and 5/6.
Area 123 catch is 79,890lb per yr (10% of total halibut caught) and a 15% reduction would be 11,984lb.
If they shut down Jan to June until 13th = 11,009lb.
They would meet their 15% reduction. So, halibut fishing is only open June 14 to Oct 1st which are their highest catch ratio.
These closures would also apply to boarding areas such as 121, 124, 125, 126, 127.
Areas 19/20 combined because you can fish either area within a 30 minute drive.
Total catch in both areas is 47,167lb ( 5.9% of the total halibut caught) and a 15% reduction would be 7,075lb.
If they shut down areas 19/20, Jan to March 10th and Aug 1st to Dec 31st that would account for 6,973lb and close to the 15%.
Halibut fishing would be open March 10th to July 31 which is the highest catch season
Every area keeps it prime time fishing, the fish size ratio remains the same and everyone suffers the 15% reduction in catch.
This is just a suggestion and the numbers and closures need to be based on last years catch ratios for each area.