CWT Indicator Stocks
We downloaded the mortality distribution tables for all CTC indicator stocks (PSC CTC 2021), which contains exploitation rate data derived from CWT recoveries in fisheries from Alaska to California. We then extracted the information for Canadian stocks and manipulated the data for analysis in R. The mortality distribution tables provide estimates of mortality in fisheries for CTC indicator stocks.
These were converted to ERs and SEAK fishery data was compiled. Six SEAK fisheries were identified, SEAK net, troll and sport, and SEAK Terminal net, troll and sport. We did not include the Terminal fisheries for stocks that return to north and south coast BC in figures, since they have extremely low ERs on all stocks in the vast majority of years (not including Transboundary Rivers, which have much higher terminal SEAK ERs). However they are included in calculations of total SEAK ER by stock. We identified 15 stocks with information on SEAK ERs in our summary.
• Median exploitation rates in SEAK net and sport fisheries range from 0 to ~ 5%, and median ERs in SEAK troll fisheries range from 0 to 15% (Figure 15). SEAK troll fisheries have the highest median ERs for all stocks. Stocks from all regions (ECVI, Fraser, ISC, North Coast, and WCVI) have significant ERs in SEAK fisheries.
• Furthermore, 2 groups of stocks are immediately apparent; there are many stocks (Nanaimo, Cowichan, Harrison, Chilliwak, Nicola and Dome) that have very low presence in any of the SEAK fisheries. This is consistent with what we know about their life history and marine distribution patterns (see for example Riddell et al. 2013).
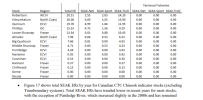
• Median total SEAK ERs range from near 0 to 20% (Table 2, Figure 16)Table 2: Median total and fishery specific SEAK ERs for CTC indicator stocks included in this summary.. There is no consistent pattern across regions, SEAK ERs are highest on Robertson Chinook, followed by Kitsumkalum and Quinsum, and then Phillips, Lower Shuswap, Atnarko, Big Qualicum, Middle Shuswap and Puntlege. Table 2: Median total and fishery specific SEAK ERs for CTC indicator stocks included in this summary.


