New wind and wave app

Cool site, I've just gotten back into web app building after 10 years of doing other things. Lots changed.

What did you go with for your backend framework?
nice! Feels like a new language or framework pops up each day now.

This is built on react for front end and node for back end. One of my favourites.
 
I've added all fishing areas between campbell river and victoria. Working on adding some ability to hover and get the zone highlighted then eventually display a simpler version of the regs.

Waveheights for JDF and victoria area are on their way. Just running the model through a few years of data.
 
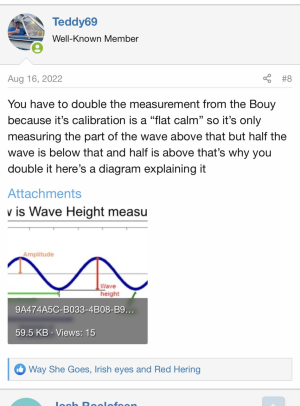
Great app! It appears to be doubling the Georgia Strait and English Bay wave height relative to Environment Canada's readings.
 
I meant to say "shows" that the wave is measured from crest to trough and is taken as an average over time. To be fair
It sure seems lumpier out there than the bouy reports at times. But that's what I found on the env can website.
 
 
Great App jCon 12. Can't keep my eyes off it. Every time I open it up it seems like you have added something new. I now see all the RCA's noted, don't believe that they were all there last week. Will tides and currents be added also? If not that's ok, what you have already is great. Thank you. Will make preparing to cross the strait less stressful.
 
@P999mm yep tides for sure as thats relatively easy. Hopefully get that setup shortly and can show you the closest to your location and let you search.

The RCA and sponge reefs have been added for areas 16, 17, 18, 29 and 28.. it is 100% manual and you have to convert all coordinates so its a bit of a slow build in the evenings :)

Appreciate the feedback.
I wonder if a DFO enquiry to the right person would land you the digital files for all these layers, or at least point you to the appropriate map server so you could just dynamically serve the appropriate layers if you are able to do that?
 
I wonder if a DFO enquiry to the right person would land you the digital files for all these layers, or at least point you to the appropriate map server so you could just dynamically serve the appropriate layers if you are able to do that?
I think they should just pay him to make their crap better LOL. Or the FishingBC app should pay him to add this to their app.
 
I wonder if a DFO enquiry to the right person would land you the digital files for all these layers, or at least point you to the appropriate map server so you could just dynamically serve the appropriate layers if you are able to do that?
I do not believe DFO, at least in BC, have the required tech for map services yet. You’d have to contact Wilf Luedke for possible data but that may not work for your app. I could help you with that tho.
 
I contacted the gov earlier this week asking for data but was just pointed to the public pages which (kind of) list the coordinates. Since so many of the zones run along the shoreline I don't think they actually have the coordinates stored anywhere and have only drawn them over top a map (like stencilling).

Part of what makes me think this hasn't been done.. it is incredibly manual. You can see on the fishingBC app they don't follow the shoreline perfectly so someone has likely plotted the fishing areas by hand grabbing each coordinate manually.
 
Hi all,

I just put together a website ( straitweather.com ) which displays the current weather conditions at some government buoys and wind stations. I plan to add several additional features such as:

- tides
- self reporting for current conditions
- weather and wave forecast tool
- maybe even a fishing journal which you can share publicly showing your catch depths, lures etc

For the meantime it displays the latest (on the hour) weather update. If the buoy is working and displaying wave height I will use that, for areas without buoy data I run the wind speed, direction etc through my own machine learning algorithm which predicts the wave height. This is shown by the colouring on the map.

While viewing on your computer or ipad you will see a graph of the past 6 hours after clicking on one of the icons. If on mobile only the small infowindow will show.

You can also review the table in the top left corner and select a station or buoy to see the popup window with more details. This table can also be minimized using the small " - " button above it.

Looking for suggestions as I'd love to continue to add new features and will likely turn it into a mobile app for Iphone and android.

Hope you find it helpful!

straitweather.com
Great job jcon! There more info on waves, wind and sea state available through the ONC portal and may be of interest for everyone at:

These articles may also be of interest:

The-predicted-tidal-velocity-in-the-southern-part-of-the-Strait-of-Georgia-at-1400-on-26.png


Last edited:
I contacted the gov earlier this week asking for data but was just pointed to the public pages which (kind of) list the coordinates. Since so many of the zones run along the shoreline I don't think they actually have the coordinates stored anywhere and have only drawn them over top a map (like stencilling).

Part of what makes me think this hasn't been done.. it is incredibly manual. You can see on the fishingBC app they don't follow the shoreline perfectly so someone has likely plotted the fishing areas by hand grabbing each coordinate manually.
Being in the mapping and GIS business, it has always astounded me how poor the DFO maps are and how haphazardly organised the regs are. It would be relatively easy for them to set up a geospatial data server with all the regs and management zones, closure areas etc for finfish and shellfish in one easy spot for fishers to access. The fishing BC app has helped a lot in that regard, but there is definitely room for improvement. DFO does have meets and bounds descriptions for all the areas and those are easy to punch into a GIS and have it draw the outline in a spatial coordinate system which I am assuming is what you are doing. But as you say it all takes time.
 
as far as openings/closings - if you know the DFO Area of interest you can access those data through:

DFO Area maps at:

Meets and bounds at:
appreciate the links!

the most cumbersome part of mapping any/all of this is the actual shoreline coordinates which the dfo do not list.
 
Back
Top