Climate: LNG in B.C. vs Alberta tarsands

Status
Not open for further replies.
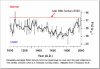
The difference is that there has been no warming over the last 18 years and even your side agrees with that.
So if you say that is wrong then you are going against your scientists.
Mann one of your leaders agrees with the pause.
So disagree with him and you have less creadibility than before.

Since the end of the Last Ice Age about 12,000 years ago, the Earth has generally experienced a warm climate. However, the climate has not been stable during this period, when temperatures have varied for long periods. We have generally had a slightly cooler climate during the last 4,000 years, and the ocean currents in the North Atlantic have been weaker.


This paper is about paleoclimate do you understand what that means?
That's what is wrong with your team... they are a bunch of amateurs thinking they know more then what the scientist that write the paper. Your team didn't even read the paper to see what is was about before jumping on it to make a case against climate change. I suspect your denial website has not a clue what the paper means and what the evidence is in the paper to prove their point. If those amateurs did read the paper and looked at the supporting documents and still had a working brain cell they would not have posted it on their denial website. Yup "team coming up short" on brain cells that is.....

The first samples that were taken for analysis were dated at 75 years before today...... That's why they call it paleoclimate and your first clue should have been when they mention 4,000 years ago......
ftp://rock.geosociety.org/pub/reposit/2015/2015073.pd


OBD If your going to act like a scientist you better start doing your home work because your not coming across as someone we should listen to....
 
Last edited by a moderator:
Mann one of your leaders agrees with the pause.

And again you have no idea what you are talking about.... Typical
Would you quit making stuff up......
Let's see what Mann says....

http://www.realclimate.org/index.ph...cillations-and-the-global-warming-faux-pause/
Climate Oscillations and the Global Warming Faux Pause

Despite widespread such claims in contrarian circles, human-caused warming of the globe proceeds unabated. Indeed, the most recent year (2014) was likely the warmest year on record.
It is true that Earth’s surface warmed a bit less than models predicted it to over the past decade-and-a-half or so. This doesn’t mean that the models are flawed. Instead, it points to a discrepancy that likely arose from a combination of three main factors (see the discussion my piece last year in Scientific American). These factors include the likely underestimation of the actual warming that has occurred, due to gaps in the observational data. Secondly, scientists have failed to include in model simulations some natural factors (low-level but persistent volcanic eruptions and a small dip in solar output) that had a slight cooling influence on Earth’s climate. Finally, there is the possibility that internal, natural oscillations in temperature may have masked some surface warming in recent decades, much as an outbreak of Arctic air can mask the seasonal warming of spring during a late season cold snap. One could call it a global warming “speed bump”. In fact, I have.
Some have argued that these oscillations contributed substantially to the warming of the globe in recent decades. In an article my colleagues Byron Steinman, Sonya Miller and I have in the latest issue of Science magazine, we show that internal climate variability instead partially offset global warming.
We focused on the Northern Hemisphere and the role played by two climate oscillations known as the Atlantic Multidecadal Oscillation or “AMO” (a term I coined back in 2000, as recounted in my book The Hockey Stick and the Climate Wars) and the so-called Pacific Decadal Oscillation or “PDO” (we a use a slightly different term–Pacific Multidecadal Oscillation or “PMO” to refer to the longer-term features of this apparent oscillation). The oscillation in Northern Hemisphere average temperatures (which we term the Northern Hemisphere Multidecadal Oscillation or “NMO”) is found to result from a combination of the AMO and PMO.
In numerous previous studies, these oscillations have been linked to everything from global warming, to drought in the Sahel region of Africa, to increased Atlantic hurricane activity. In our article, we show that the methods used in most if not all of these previous studies have been flawed. They fail to give the correct answer when applied to a situation (a climate model simulation) where the true answer is known.
We propose and test an alternative method for identifying these oscillations, which makes use of the climate simulations used in the most recent IPCC report (the so-called “CMIP5” simulations). These simulations are used to estimate the component of temperature changes due to increasing greenhouse gas concentrations and other human impacts plus the effects of volcanic eruptions and observed changes in solar output. When all those influences are removed, the only thing remaining should be internal oscillations. We show that our method gives the correct answer when tested with climate model simulations.


2015-02-12-Sci15FigHuffPost.png

Estimated history of the “AMO” (blue), the “PMO (green) and the “NMO” (black). Uncertainties are indicated by shading. Note how the AMO (blue) has reached a shallow peak recently, while the PMO is plummeting quite dramatically. The latter accounts for the precipitous recent drop in the NMO.

Applying our method to the actual climate observations (see figure above) we find that the NMO is currently trending downward. In other words, the internal oscillatory component is currently offsetting some of the Northern Hemisphere warming that we would otherwise be experiencing. This finding expands upon our previous work coming to a similar conclusion, but in the current study we better pinpoint the source of the downturn. The much-vaunted AMO appears to have made relatively little contribution to large-scale temperature changes over the past couple decades. Its amplitude has been small, and it is currently relatively flat, approaching the crest of a very shallow upward peak. That contrasts with the PMO, which is trending sharply downward. It is that decline in the PMO (which is tied to the predominance of cold La Niña-like conditions in the tropical Pacific over the past decade) that appears responsible for the declining NMO, i.e. the slowdown in warming or “faux pause” as some have termed it.
Our conclusion that natural cooling in the Pacific is a principal contributor to the recent slowdown in large-scale warming is consistent with some other recent studies, including a study I commented on previously showing that stronger-than-normal winds in the tropical Pacific during the past decade have lead to increased upwelling of cold deep water in the eastern equatorial Pacific. Other work by Kevin Trenberth and John Fasullo of the National Center for Atmospheric Research (NCAR) shows that the there has been increased sub-surface heat burial in the Pacific ocean over this time frame, while yet another study by James Risbey and colleagues demonstrates that model simulations that most closely follow the observed sequence of El Niño and La Niña events over the past decade tend to reproduce the warming slowdown.
It is possible that the downturn in the PMO itself reflects a “dynamical response” of the climate to global warming. Indeed, I have suggested this possibility before. But the state-of-the-art climate model simulations analyzed in our current study suggest that this phenomenon is a manifestation of purely random, internal oscillations in the climate system.
This finding has potential ramifications for the climate changes we will see in the decades ahead. As we note in the last line of our article,
Given the pattern of past historical variation, this trend will likely reverse with internal variability, instead adding to anthropogenic warming in the coming decades.
That is perhaps the most worrying implication of our study, for it implies that the “false pause” may simply have been a cause for false complacency, when it comes to averting dangerous climate change.


- See more at: http://www.realclimate.org/index.ph...obal-warming-faux-pause/#sthash.5nErqKhC.dpuf
 
Once again you show that you cannot read.

Michael E. Mann, a co-author on the Science paper, he told Quartz in an email, ”the Pacific Ocean has been in a natural ‘cooling’ mode, which has slowed the warming of the globe, but we expect that to reverse in the near future.
 
Thought you would appreciate this.
Note how long they had records.
 

Attachments

  • image.jpg
    image.jpg
    49.4 KB · Views: 31
Once again you show that you cannot read.

Michael E. Mann, a co-author on the Science paper, he told Quartz in an email, ”the Pacific Ocean has been in a natural ‘cooling’ mode, which has slowed the warming of the globe, but we expect that to reverse in the near future.

Try this .... next time, in your truck, when you come to a red light just slow down. If you think a pause is the same thing. Your logic is flawed....
 
Thought you would appreciate this.
Note how long they had records.

Wait a minute..... I thought you were trying to convince everyone that all the records were somehow false. That there was a global conspiracy to fudge the numbers to suit the UN so to take over the world and create a one world communist government. Now are you 100% sure the numbers are correct or is it only when it suits your agenda.

By the way you do know the difference between weather and climate... right?
If not do your homework before trying to prove a point....
 
Once again you show that you cannot read.

Michael E. Mann, a co-author on the Science paper, he told Quartz in an email, ”the Pacific Ocean has been in a natural ‘cooling’ mode, which has slowed the warming of the globe, but we expect that to reverse in the near future.

Why don't you read the science paper and tell us what Mann said. Here is the abstract.

[h=3]ATLANTIC AND PACIFIC MULTIDECADAL OSCILLATIONS AND NORTHERN HEMISPHERE TEMPERATURES[/h]The recent slowdown in global warming has brought into question the reliability of climate model projections of future temperature change and has led to a vigorous debate over whether this slowdown is the result of naturally occurring, internal variability or forcing external to Earth’s climate system. To address these issues, we applied a semi-empirical approach that combines climate observations and model simulations to estimate Atlantic- and Pacific-based internal multidecadal variability (termed “AMO” and “PMO,” respectively). Using this method, the AMO and PMO are found to explain a large proportion of internal variability in Northern Hemisphere mean temperatures. Competition between a modest positive peak in the AMO and a substantially negative-trending PMO are seen to produce a slowdown or “false pause” in warming of the past decade.

http://www.sciencemag.org/content/347/6225/988.full

Not willing to do your homework I see... Let someone else think for you....
Not working out, is it.....

Have you tried slowing down for that red light yet? It's the same as a pause, right.
Do the experiment and let us know the results OBD.
 
Over half a million views and counting.....
That's a good laugh right there...

[w833cAs9EN0]https://www.youtube.com/watch?v=w833cAs9EN0
 
For those who can argue with peer reviewed papers. This is for you.

Full paper is here.
http://www.kestencgreen.com/green&armstrong-agw-analogies.pdf


The global warming alarm:
Forecasts from the structured analogies method
Kesten C. Green
International Graduate School of Business, University of South Australia GPO Box 2471, Adelaide SA 5001, Australia. kesten@me.com; kestencgreen.com; T +61 8 8302 9097; F +61 8 8302 0709
J. Scott Armstrong
The Wharton School, University of Pennsylvania armstrong@wharton.upenn.edu; jscottarmstrong.com; T +1 610 622 6480
31 March 2011 AGW88-KG.doc.

NOTE: We seek peer review from others, especially with
evidence that would challenge our findings or conclusions.

Latest version available at http://kestencgreen.com/green&armstrong-agw-analogies.pdf SSRN Working Paper Version available at http://ssrn.com/abstract=1656056
ABSTRACT
When the beach patrol raises the alarm that a shark has been sighted we know what to do, but how should we respond to an alarm that is based on predictions of what will happen 100 years from now and the person raising the alarm tells us we must make great sacrifices now to avoid the predicted catastrophe? To answer this question, we forecast effects and outcomes of the current global warming alarm using a structured analysis of analogous situations. To do this, we searched the literature and asked experts to identify phenomena that were similar to the alarm currently being raised over dangerous manmade global warming. We obtained 71 proposed analogies. Of these, 26 met our criteria that the alarm be: (1) based on forecasts of human catastrophe arising from effects of human activity on the physical environment, (2) endorsed by experts, politicians and the media, and (3) that were accompanied by calls for strong action. None of the 26 alarms were based on scientific forecasting procedures. None of the alarming forecasts were accurate. Governments took action in 23 of the analogous situations and those actions proved to be harmful in 20. The government programs remained in place after the predicted disasters failed to materialize. The global warming alarm movement appears to be the latest manifestation of a common social phenomenon: false alarms based on unscientific forecasts of human-caused environmental disasters. We predict that the alarm over forecasts of dangerous manmade global warming will, like previous similar alarms, result in harm
 
Last edited by a moderator:
Once again, please read what I said, not what you wanted it to say.
By the way I do not own a truck, that is you.


Wait a minute..... I thought you were trying to convince everyone that all the records were somehow false. That there was a global conspiracy to fudge the numbers to suit the UN so to take over the world and create a one world communist government. Now are you 100% sure the numbers are correct or is it only when it suits your agenda.

By the way you do know the difference between weather and climate... right?
If not do your homework before trying to prove a point....
 
For those who can argue with peer reviewed papers. This is for you.


The global warming alarm:
Forecasts from the structured analogies method
Kesten C. Green
International Graduate School of Business, University of South Australia GPO Box 2471, Adelaide SA 5001, Australia. kesten@me.com; kestencgreen.com; T +61 8 8302 9097; F +61 8 8302 0709
J. Scott Armstrong
The Wharton School, University of Pennsylvania armstrong@wharton.upenn.edu; jscottarmstrong.com; T +1 610 622 6480
31 March 2011 AGW88-KG.doc.

NOTE: We seek peer review from others, especially with
evidence that would challenge our findings or conclusions.

Whats wrong with this guy is his co-author busy?
Perhaps looking for new data fudge?
OBD why don't you double check your instructions before posting here.
It would save you some embarrassment that you know will be coming your way.


[h=1]Validity of climate change forecasting for public policy decision making[/h]

[h=1]Polar Bear Population Forecasts: A Public-Policy Forecasting Audit[/h]J. Scott Armstrong, University of Pennsylvania
Kesten C. Green, Monash University
Willie Soon, Harvard-Smithsonian Center for Astrophysics


I read an article the other day about the 97% consensuses between climate scientists.
It was pointed out that when you remove the Soon-gate papers the number goes to 99%
Makes you wonder what the fuss is about.... LOL
 
Once again, please read what I said, not what you wanted it to say.
By the way I do not own a truck, that is you.

there I fixed it now answer the question...

Have you tried slowing down for that red light yet? It's the same as a pause, right.
Do the experiment and let us know the results OBD
 
Antarctic Sea Ice Did The Exact Opposite Of What Models Predicted

Climate models can be good tools for predicting future sea ice levels — unless, of course, they are completely wrong.

In the case of Antarctica, the climate models were dead wrong, according to a new study by Chinese scientists published in the journal Cryosphere. The study found that most climate models predicted Antarctic sea ice coverage would shrink as the world warmed and greenhouse gas levels increased.

The opposite happened. Most climate models analyzed in the study predicted Antarctica would shrink between 1979 and 2005, but instead south pole sea ice levels increased during that time. Going a step further, sea ice levels have only increased since 2006, hitting all-time highs for sea ice coverage in September of last year.

“For the Antarctic, the main problem of the [climate] models is their inability to reproduce the observed slight increase of sea ice extent,” researchers wrote in their study.

“Both satellite-observed Antarctic [sea ice extent] and [satellite measured] Antarctic [sea ice volume] show increasing trends over the period of 1979–2005, but [climate models’] Antarctic [sea ice extent] and [sea ice volume] have decreasing trends,” researchers added. “Only eight models’ [sea ice extent] and eight models’ [sea ice volume] show increasing trends.”

Chinese scientists only looked at sea ice projections until 2005. Had they kept going, they would find more than a trend of “slightly increasing” sea ice levels. Last year was the first year on record that Antarctic sea ice coverage rose above 7.72 million square miles.

By Sept. 22, 2014, sea ice extent reached its highest level on record — 7.76 million square miles. Antarctica is now in its melt season, but even so, sea ice levels were very high for late December and early January.

The same can’t be said for Arctic sea ice coverage. The Chinese study notes that for the Arctic “both climatology and linear trend are better reproduced.” Climate models predicted Arctic sea ice extent and volume would decrease as the world warmed, which it has.

In January 1979, sea ice extent averaged about 6 million square miles for the month. By 2006, sea ice extent averaged above 5.2 million square miles for January — one of the lowest sea ice levels for January on record.

Since 2006, however, the Arctic has stabilized and has even increased slightly. Sea ice extent for January 2015 was 19,000 square miles above the record low extent in January 2011. The National Snow and Ice Data Center reported that “Arctic sea ice extent for January was the third lowest in the satellite record. Through 2015, the linear rate of decline for January extent over the satellite record is 3.2% per decade.”
 
It's ok, I knew you were unable to reply as you are not a scientist and have no peer reviewed papers.


Whats wrong with this guy is his co-author busy?
Perhaps looking for new data fudge?
OBD why don't you double check your instructions before posting here.
It would save you some embarrassment that you know will be coming your way.


[h=1]Validity of climate change forecasting for public policy decision making[/h]

[h=1]Polar Bear Population Forecasts: A Public-Policy Forecasting Audit[/h]J. Scott Armstrong, University of Pennsylvania
Kesten C. Green, Monash University
Willie Soon, Harvard-Smithsonian Center for Astrophysics


I read an article the other day about the 97% consensuses between climate scientists.
It was pointed out that when you remove the Soon-gate papers the number goes to 99%
Makes you wonder what the fuss is about.... LOL
 
It's ok, I knew you were unable to reply as you are not a scientist and have no peer reviewed papers.

Oh what a burn... no I'm not a scientist but there are plenty out there that I will listen to when they tell me to take this seriously. Do you have any left on your team that are climate scientists that have a sherd of credibility left?

answer the question...

Have you tried slowing down for that red light yet? It's the same as a pause, right.
Do the experiment and let us know the results OBD

You keep claiming a pause well lets see your logic...

Here is a video that if you replace a few words is the same argument.
Just substitute “climate change” for “measles”, “Renewable Energy” for “vaccines”, and “Climate scientists” for “Doctors”, the parallels are uncanny

[QgpfNScEd3M]https://www.youtube.com/watch?v=QgpfNScEd3M
 
Your leader. Pretty sad.

Quote of the week: former IPCC head Pachauri’s emails could be a whole new potboiler novel

From the hot climate made him do it department comes this report from Donna LaFramboise on the “hacker generated” emails allegedly not from former IPCC head Rajenda Pachauri. You might need a bath after you read some of these.

An online Indian news source has published a collection of electronic messages allegedly sent by Pachauri to this unnamed 29-year-old woman. They now form part of a police document known as a First Information Report (FIR). The online version of these messages is difficult to read, so I’ve cut-and-pasted the text, added some formatting, and produced a 23-page PDF available here.

Pachauri, the recently resigned chairman of the UN’s Intergovernmental Panel on Climate Change (IPCC), has PR flaks and a legal team. What is his version of events? Here’s a quote from a Reuters news story:

[Pachauri’s] lawyers have said his computer and mobile phone were hacked and that vested interests were maligning him because of his outspoken stand on global warming.

Shadowy, nefarious interests are out to get him, so they hacked his electronic devices to make him look bad. Nice try, but few people who examine firsthand the text messages and e-mails Pachauri says are fake are likely to believe that.


…Pachauri is apparently the kind of boss who not only expresses opinions about whether his subordinates should go to the gym, he’s the sort who tells female employees:

I am yours for life…and will always be yours, even when someone else enters your life.

And you have hurt me so often by being inconsistently cold on so many occasions. Not letting me touch you, even though I have always treated your body with reverence and as sacred. Perhaps, you regard a physical relationship as a matter of expediency and convenience. Well I don’t, and certainly not with your body which I worship, as you should have found out by not. Even when I “grabbed you body” I had my left hand over your right breast. Did I make even the slightest attempt to hold it in my hand or fondle you there? [typos in original, p. 6, line 180+]

He’s a prize, all right. In a few lines, he criticizes her for trying to fend him off, implies that she must be a slut since she objects to his ‘reverent’ embrace, and argues that he’s virtuous because he didn’t take as many liberties as he might have.

As the Shub Niggurath blog observed yesterday, this sordid saga took a vicious turn in December 2014. Not wanting to sit beside him on a plane one more time, this young woman attempted to sit on her own in economy class. Pachauri allegedly responded with an e-mail that reads in part:

you should reflect on the massive insult you heaped on me by indicating that I was so toxic that you would prefer not to sit next to me on the plane. If that be the case there is no room for any interaction between us…To me that act of yours represented the ultimate in haughtiness, arrogance and insulting behaviour. If you had any human sensitivity you would have realised what you have done, and possibly apologised.

You are welcome to remain a paid guest of TERI. I really would not burden you with any work in future. [p.20, line 754+]

I’ve read all of these electronic messages twice. They tell the story of a young woman who, following months of valiant struggle, perseverance, and vast patience effectively loses her job because she won’t let her boss grope her.

At the end of the police document, the complainant sums up her overall experience:

Whenever I had to travel with Dr. Pachauri for work, he would use the opportunity to constantly say vulgar and demeaning things to me. Whenever I sat next to him on the flight, he would try to hold my hand and tell me how much he loved me. If I ever spoke to any other male colleague, he would remark that I was going to sleep with him. I made repeated requests and pleas to Dr. Pachauri to stop this behaviour towards me. I have categorically told him not to touch me in appropriately or to hold me or kiss me, but Dr. Pachauri did not stop…

I feel broken and scarred in body and mind due to Dr. Pachauri’s behavior and actions…I get frequent panic attacks due to the constant harassment and being made to feel like an object of vulgar desire from this man, who is old enough to be my grandfather…

Till date I was extremely scared of going and reporting the behaviour of Dr. Pachauri, as he is the head of the organization for which I work and I did not know who I could turn to for help. I have tried to ignore and brush aside a lot of offensive behaviour from Dr. Pachauri as I was very scared of losing my reputation and employment if I complained to anyone…I request you to register my complaint against Dr. Pachauri and bring him to justice. [pp. 20-21, line 785+]

Donna adds:

“…anyone who goes to the trouble of looking directly at this collection of electronic messages will find it difficult to believe that this matter has anything to do with villainous hackers trying to smear a climate warrior.”
 
Your leader. Pretty sad.

Quote of the week: former IPCC head Pachauri’s emails could be a whole new potboiler novel

From the hot climate made him do it department comes this report from Donna LaFramboise on the “hacker generated” emails allegedly not from former IPCC head Rajenda Pachauri. You might need a bath after you read some of these.

Give it a rest OBD your team is looking like a couple of these guys....

le%2Bpoitevin%2B1860.jpg
 
The pause, as you call it.
 

Attachments

  • image.jpg
    image.jpg
    53.9 KB · Views: 18
Evidence Of A Warmer Holocene In The Andes

By Paul Homewood

h/t Ben Vorlich

image

http://www.amjbot.org/content/97/9/1579.full

It is no secret that the Andes were warmer up to around 5000 years ago than now. Lamb and others have concluded that temperatures were maybe 2C higher then.

There is also evidence from ice cores that the MWP was at least as warm as the late 20thC.

l2_quelccaya2_thumb

https://notalotofpeopleknowthat.wordpress.com/2014/04/09/peru-had-a-mwp-lia/

One of the strands of evidence is the discovery of plant remains, discovered as glaciers there recede, which are carbon dated to 5000 years ago. The paper quoted above makes the interesting comment that:

we found evidence of at least five taxa characteristic of wetlands, which occur primarily at lower elevations in the region today.


This would indicate that the climate then was significantly warmer than today.
 

Attachments

  • image.jpg
    image.jpg
    76.1 KB · Views: 14
  • image.jpg
    image.jpg
    47.5 KB · Views: 14
Why in the world would you link a study of plant material from 4576 and 5222 yr old with a graph of temps going back 2000 years. Are we to some how be convinced that the two should line up and we take your word that it was 2 degrees warmer then today? Even if we are to believe your effed up evidence don't you think that it's disturbing to know that we are on track to warm by 4 to 6 degrees in next century if we don't get this CO2 problem fixed right away? Amateurs on your side like the retired accountant Paul Homewood are doing a disservice to you pet theory denial claims. But then again we all ready know what drum beat you march to so keep it up your looking silly every time you post and anyone reading this can clearly see that.

I'll ask again... do you think slowing down is the same as a pause?
How would that work out for you at a red light?
No answer to the logic question, why am I not surprised.


name and shame and put a face to them
Paul Homewood

homewood.jpg
 
Last edited by a moderator:
Status
Not open for further replies.
Back
Top