Climate: LNG in B.C. vs Alberta tarsands

Status
Not open for further replies.
Love it when you pretend to be a scientist.
I do not and never did pretend to be.
As before, if you think you are one then past your thoughts on her site and let's see how it goes.
Wait I have said this to you before and yet you never do it.
I see that your teams computer models are still not close to what they said they would be.
I see that they are looking at the playing around with temperatures.
You better get this fixed as your leader Al said the world is going to end real soon.

I see they are trying to get her to be the head of the IPPC, that would be a positive thing.


A very interesting debate is going on over on Judith Curry website in regards to the Monchton, Soon etal paper.
http://judithcurry.com/2015/03/01/lessons-from-the-irreducibly-simple-kerfuffle/

I'l point out two things that have not been addressed by the Monckton and his simple climate model. So does the paper have value? Yes it does if these problems are addressed.

Before I get to that lets set this up....
We have climate deniers, climate skeptics and climate alarmists.
It seems to me that climate deniers refuse to believe that CO2 has any effect on temperature. Some also refuse to believe that the earth is getting warmer (hoax theory) or if it is, it's natural (no mechanism, it just is).
We then have Climate skeptics that accept greenhouse gas theory but argue that the sensitivity is low and therefore it will not be a problem for many years to come. (100, 200 years perhaps)
Last we have climate alarmist that accept IPCC at face value and all the science that goes with it.

Next we need to know what the paper means. I'll just copy paste from Judiths website.


The important part is Climate Sensitivity this is the bone of contention between climate skeptics and climate alarmists. Climate deniers just refuse that there is any effect CO2 has on temp (doh).... This is important when we try to calculate the effect that doubling the CO2 in the atmosphere and what the temperature will be.

For this we will use Rud Istvan's explanation on how the math works.


Now for the part I see wrong with the paper.
No explanation as to why Monckton used these 2 numbers in his calculations to get his sensitivity.
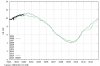
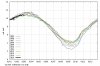
OBS: HadCRUT4, 63 yr at (hidden number)
OBS: RSS, 17 yr at (hidden number but looks like zero: OBD has this in his sig line)
Average is 0.09 (looks like a weighted average)

So what problem do I see here?

Is this not just a cherry pick of the data to get that 0.09 to make the rest of his calculations work?
Why use 63 years when you could use 30 years? The reason is that if you want to lower this number you go back further in time to before things started heating up. It's all about the average and the amount of samples.
here is an example. 1+2+3+4+5+6 (60 years) avg is 3.5 or 4+5+6 (last 30 years) avg is 5
So now we see how moving the starting point has an effect on the number to use in the Monckton calculations.
Next there is the 17 yr number. Why is this number used? Why not 20 of 30 yr. Well this is the RSS satellite data and it only goes back so far. But if you use all the data you get the number .125 and not zero. Again Monckton needed this number to be zero or his calculation (average) would not work out and it would then mess up his final model. That would have put his sensitivity higher and he can't have that can he.

figure-6.png


So if Monckton want's to fix this then his model will have value as a "on the back of an envelope" quick calculation that would be great for anyone that want's to get an idea what doubling of CO2 means in the future. I would like to see it in MS Excel so as new information comes in the we could see the results and when we could expect a 2C world.

So far from what I'm reading is that the climate deniers are cheering Monckton and they don't see that the model needs CO2 to behave as a greenhouse gas and that is at odds with their hoax theory. (there not quick on the uptake) The climate skeptics are looking at it and have reservations on it's value. And the Climate alarmists are dismissing it as junk that should never have made it past peer review.

My guess is that the paper will get retracted so that the inputs can be corrected and we will see if the conclusions are still the same. If not then the paper goes to the dustbin of other failed ideas from the Lord Bunken.

So OBD an CK what are your thoughts?
Is either of you up to the task of commenting?
You both claim to know something, time to prove it.
 
Oops!
KOOMEY AND ROMM: THE MOTE AND THE BEAM

A team of climate researchers and activists fail to disclose federal funding and scold climate sceptic Willie Soon for not disclosing funding

Willie Soon has been under fire from climate activists for a long time. The latest round has turned ugly, ensnaring collateral targets like Roger Pielke Jr, Judith Curry, Richard Lindzen among others in questions of funding.

On his blog Pielke Jr remarked how undisclosed conflicts were ‘endemic’, and pointed to a paper† by Jonathan Koomey, Joe Romm and co-authors, published in Environmental Research Letters as an example. He quoted the instructions to authors from the journal:

“… All sources of financial support for the project must also be disclosed in the acknowledgments section. The name of the funding agency and the grant number should be given, for example: “This work was partially funded by the National Institutes of Health (NIH) through a National Cancer Institute grant R21CA141833.”

Koomey and Romm appeared on the Huffington Post with an article co-signed by scientists who are among the 53 authors of the paper. They declare no disclosure of funding was needed because they used no financial support (emphasis mine):

The reason why there was no statement of conflict of interest is because: 1) there were no “sources of financial support for the project” (it was a labor of love to honor a giant in the energy field) […]

They point to the acknowledgements section of the paper for the assistance received

no acknowledgement

They repeat the assertion

Again, our article had no funding source …

Via Google Scholar one can find other versions of the paper. One is from SciTech Connect, a US federal public-access research database run by the Department of Energy (DOE). The entry for Koomey et al reads as follows:

Scitech Connect

A pdf draft of the paper available from the page. Note the highlighted item against the field ‘DOE Contract Number’.

Interestingly, the acknowledgment section here states the work was supported by a US Department of Energy contract:

Acknowledgments

The blue box is from text being added separately using a pdf editor. Acrobat tells the extra text about US federal funding was added by a ‘JAWolslegel’ on the 10th of June 2009.

‘DE-AC02-05CH11231′ is a DOE ‘Prime’ federal contract with the Lawrence Berkeley National Laboratory (LBNL) where Koomey worked. It is easy to find that a Jean Wolslegel works as ‘report coordinator’, checking to see scientific documents published by the lab ‘comply with DOE and LBNL requirements’ and submits them to ‘DOE’s Office of Scientific and Technical Information (OSTI)’.

OSTI runs Scitech Connect—is how Koomey et al 2010 ends up there, with reporting of funding ‘in compliance with the DOE’. The paper was originally submitted to the journal in March 2009. The authors sent the paper to the journal without declaring funding but the same paper was submitted to a DOE data agency as product of federally-funded research.

Conclusion? Either Koomey et al worked on their own time, published the paper and falsely declared the work as DOE-funded to a US government agency. Or, Koomey and co-authors’ work was federally funded and reported to authorities appropriately but they failed to declare funding in Environmental Research Letters. It has to be one or the other, and either constitutes a lapse.

They irony is Koomey and Romm’s actions are like Soon’s: failure to disclose funding to journal. Only in Soon’s case the funding agency stipulated non-disclosure in some instances and in others the journal had no policy or requirement for disclosure. Not only do Koomey and Romm fail to disclose funding, they expressly state the opposite trying to morally berate a fellow scientist.

References:
† Defining a standard metric for electricity savings. Koomey J, Akbari H, Blumstein C et al Environ. Res. Lett. 5 (Jan-Mar 2010) 014017) 10.1088/1748-9326/5/1/014017
 
Oops.
Former IPCC Climatologist Lennart Bengtsson Calls Out Spiegel On Climate Gloom: “Wrong…Hopelessly Naïve…Ought To Know Better”

Former IPCC Climatologist Lennart Bengtsson Calls Out Spiegel On Climate Gloom: “Wrong…Hopelessly Naïve…Ought To Know Better”
Some days ago I wrote about how German news weekly Der Spiegel had resorted once again to catastrophe-hopping when it recently rolled out its print edition whose front cover featured a burning planet caused by human climate change.

Skeptics in Europe reacted harshly, but at the same time dismiss the doomsday piece as a desperate sensationalism stunt in a bid to stem its hemorrhage of readers.

Alarmist views “wrong, completely naïve”

Some criticism even came from rather hefty figures in the climate scene. For example Swedish professor Lennart Bengtsson, former IPCC climatologist and former head of the German Max Planck Institute for Meteorology in Hamburg.

Hat-tip: Hans Labohm

Bengtsson posted a commentary concerning the Spiegel doomsday piece at the Swedish Anthropocene site here. He calls the alarmist views of book author Naomi Klein, which Spiegel cited in its article: “not only wrong, but also hopelessly naïve.”

No basis showing weather has gotten more extreme

Bengtsson, who has gravitated from being an regular alarmist to a non-alarmist like-warmer over the years, thinks that the growing emission of greenhouse gases is a problem over the long term, but that it is not an urgent problem. He writes there is no scientific basis showing the weather has become more extreme.

The storms are not worse than before, and they will be fewer in a warmer climate as a result of the polar regions warming up.”

No urgency

On sea level Bengtsson writes that it is now rising at about 3 mm per year, but has not accelerated over the past 23 years. It makes no sense to rush and to make “hasty and inaccurate decisions“. He writes:

The reason for the increased emissions of carbon dioxide is the increasing earth‘s population and the desire of all the poor to live a life that is a little better and more hopeful, and perhaps someday even take a taxi at any time – surely among some of Naomi Klein’s environmental sins.”

Bengtsson calls the belief that a non-capitalist system can solve the earth’s energy and environmental problems “completely naïve” and uninformed, citing past failed experiments in socialism.

If anyone ought to be familiar with the costs needed to solve the problems left behind by communist East Germany, it is Spiegel. The Elbe River was a dead river at the time of the German reunification. Now, thanks to the capitalist system, it has returned to life.”

As an example of a successful approach to lower CO2, emissions, Bengtsson uses the United States: “In fact, one of the few countries that has significantly reduced CO2 emissions are the United States, through its growing gas exploration!”

Bengtsson adds:

The only hope to solve the planet’s long-term environmental problems is via the open and free society, not least of all by a socialist dictatorship on a global scale. This at least Spiegel’s editors ought to know.”
 
So what climate model has Bode equation in it?
A search of this question has turned up this.....
https://realagenda.wordpress.com/tag/james-hansen/page/2/


Ok fair enough.... let's check the IPCC PDF he claims that the models use the Bode Equation....
http://www.ipcc.ch/pdf/assessment-report/ar4/wg1/ar4-wg1-chapter8.pdf

Nope nothing in there that say the models use the Bode Equation.

Perhaps that's why the Lord Bunken won't tell us this answer.
http://hockeyschtick.blogspot.ca/2015/03/moncton-assumption-that-temperature.html

Be my guest and find the papers from Hansen that Lord Bunken claims that some how climate models are based on Bode equations. Go ahead and try.... You wont find it... it's red herring for the misfits. Bunken is trying to give you the impression that Climate Models are based on Bode equations when they are not. He just want's you to think that and by your post it worked. Your team is so easy to fool.... what does that make you.

IPCC Chapter 8.JPG

“Under these simplifying assumptions the amplification [f] of the global warming from a feedback parameter (in W m–2 °C–1) with no other feedbacks operating is 1 / (1 – [bκ–1]), where [–κ–1] is the ‘uniform temperature’ radiative cooling response (of value approximately –3.2 W m–2 °C–1; Bony et al., 2006). If n independent feedbacks operate, is replaced by (λ1 + λ 2+ ... λ n).” (IPCC, 2007: ch.8, footnote).

Thus, κ≈ 3.2–1 ≈ 0.313°K W–1 m2. (7)


3. The feedback multiplier f is a unitless variable by which the base forcing is multiplied to take account of mutually-amplified temperature feedbacks. A “temperature feedback” is a change in TSthat occurs precisely because TShas already changed in response to a forcing or combination of forcings. An instance: as the atmosphere warms in response to a forcing, the carrying capacity of the space occupied by the atmosphere for water vapor increases near-exponentially in accordance with the Clausius-Clapeyron relation. Since water vapor is the most important greenhouse gas, the growth in its concentration caused by atmospheric warming exerts an additional forcing, causing temperature to rise further. This is the “water-vapor feedback”. Some 20 temperature feedbacks have been described, though none can be directly measured. Most have little impact on temperature. The value of each feedback, the interactions between feedbacks and forcings, and the interactions between feedbacks and other feedbacks, are subject to very large uncertainties.

Each feedback, having been triggered by a change in atmospheric temperature, itself causes a temperature change. Consequently, temperature feedbacks amplify one another. IPCC (2007: ch.8) defines f in terms of a form of the feedback-amplification function for electronic circuits given in Bode (1945), where b is the sum of all individual feedbacks before they are mutually amplified:

f = (1 – bκ)–1 (8)

= ΔTλ/ ΔTκ

Note the dependence of f not only upon the feedback-sum b but also upon κ –

ΔTλ =(ΔF + bΔTλ)κ

==> ΔTλ (1 – bκ) = ΔFκ

==> ΔTλ = ΔFκ(1 – bκ)–1

==> ΔTλ/ ΔF = λ = κ(1 – bκ)–1 = κf

==> f = (1 – bκ)–1 ≈ (1 – b /3.2)–1

==> κ ≈ 3.2–1 ≈ 0.313 °K W–1 m2. (9)

Equivalently, expressing the feedback loop as the sum of an infinite series,

ΔTλ = ΔFκ+ ΔFκ 2b + ΔFκ 2b2 + …

= ΔFκ(1 + κb + κb2 + …)

= ΔFκ(1 –κb)–1

= ΔFκf

==>λ = ΔTλ/ΔF = κf (10)

Bode.JPG

http://www.aps.org/units/fps/newsletters/200807/monckton.cfm
 
View attachment 16549

“Under these simplifying assumptions the amplification [f] of the global warming from a feedback parameter (in W m–2 °C–1) with no other feedbacks operating is 1 / (1 – [bκ–1]), where [–κ–1] is the ‘uniform temperature’ radiative cooling response (of value approximately –3.2 W m–2 °C–1; Bony et al., 2006). If n independent feedbacks operate, is replaced by (λ1 + λ 2+ ... λ n).” (IPCC, 2007: ch.8, footnote).

Thus, κ≈ 3.2–1 ≈ 0.313°K W–1 m2. (7)


3. The feedback multiplier f is a unitless variable by which the base forcing is multiplied to take account of mutually-amplified temperature feedbacks. A “temperature feedback” is a change in TSthat occurs precisely because TShas already changed in response to a forcing or combination of forcings. An instance: as the atmosphere warms in response to a forcing, the carrying capacity of the space occupied by the atmosphere for water vapor increases near-exponentially in accordance with the Clausius-Clapeyron relation. Since water vapor is the most important greenhouse gas, the growth in its concentration caused by atmospheric warming exerts an additional forcing, causing temperature to rise further. This is the “water-vapor feedback”. Some 20 temperature feedbacks have been described, though none can be directly measured. Most have little impact on temperature. The value of each feedback, the interactions between feedbacks and forcings, and the interactions between feedbacks and other feedbacks, are subject to very large uncertainties.

Each feedback, having been triggered by a change in atmospheric temperature, itself causes a temperature change. Consequently, temperature feedbacks amplify one another. IPCC (2007: ch.8) defines f in terms of a form of the feedback-amplification function for electronic circuits given in Bode (1945), where b is the sum of all individual feedbacks before they are mutually amplified:

http://www.aps.org/units/fps/newsletters/200807/monckton.cfm


Well done CK.
Like I said Bunken is trying to give us the impression that Climate Models are based on Bode equations when they are not. They used Bode to compare some of the models and that is all they did. Don't forget that was 2007. I have not looked in IPCC 2013 so I don't know if they still do the same thing.

one should be very careful when trying to apply to the climate an equation that was
originally derived for electronic circuits.
The problem with simply borrowing Bode, bolting it on to the climate models and
hyping for the best is that – tell it not in Gath, publish it not in the streets of Askelon
– not all dynamical systems behave the same way. They fall into several classes. And
the climate falls into one of the classes to which Bode does not apply."


Bolt it on or apply it makes no difference he still wants to argue that sensitivity is low. That's not working out in the real world as the Arctic Ice cap is showing us. As you may know we are at 400 ppm and the doubling number is 450 ppm. Unless things change we will be at 450 ppm in 25 to 30 years. So it makes a difference what the sensitivity is. The way I see it this whole Bode thing is a red herring and a distraction from the real issue. If sensitivity is low, like bunken wants, then we have few extra (20 or 30) years before we reach 2C if it's high then it will be at 2C in less time and we wont have to wait 25 to 30 years and 450 ppm.
 
Love it when you pretend to be a scientist.
I do not and never did pretend to be.
As before, if you think you are one then past your thoughts on her site and let's see how it goes.
Wait I have said this to you before and yet you never do it.
I see that your teams computer models are still not close to what they said they would be.
I see that they are looking at the playing around with temperatures.
You better get this fixed as your leader Al said the world is going to end real soon.

I see they are trying to get her to be the head of the IPPC, that would be a positive thing.

I see you are doing a lot of seeing but not much thinking....
Yup you are a copy paste of what others think.
Perhaps go look at steves gonnads you will find the truth there....
Why can't you at least keep up with CK?

We will see what happens to Soon and Bunken.
0225toonwasserman.jpg
 
← Obama Believes That All Weather Is Caused By Climate ChangeWarning! Avert Your Eyes →
Arctic Sea Ice Continues To Track 2006
Posted on March 4, 2015 by stevengoddard
For the past two years, Arctic sea ice has been tracking closely to 2006, which had the highest summer minimum of the past 11 years.

ScreenHunter_7675 Mar. 04 00.23 icecover_current (1)

There has been a huge increase in older/thicker ice over the past four years

myi2011-2014 (1)
 

Attachments

  • image.jpg
    image.jpg
    58 KB · Views: 21
  • image.jpg
    image.jpg
    70.2 KB · Views: 21
Nominate Judith Curry as the next Chair of the Intergovernmental Panel On Climate Change

With Rajenda K. Pachauri now “toast“, and an AR6 in the works, this is this most logical choice forward.

WE PETITION THE OBAMA ADMINISTRATION TO:

Nominate Judith Curry as the next Chair of the Intergovernmental Panel On Climate Change.

The Intergovernmental Panel on Climate Change, an organization created by the World Meteorological Organization and the United Nations Environmental Programme, will elect a new chair this year. The post is currently being filled by an interim chair following the resignation of Rajendra Pachauri.

The United States has currently nominated Dr. Chris Field. We petition the current administration to withdraw his nomination and instead nominate Judith Curry.

Judith A. Curry is an American climatologist and former chair of the School of Earth and Atmospheric Sciences at the Georgia Institute of Technology. Her integrity, understanding of the science and related policy issues make her a better choice, for the IPCC and American interests as well.

SIGNATURES NEEDED BY APRIL 03, 2015 TO REACH GOAL OF 100,000
 
Oops!
KOOMEY AND ROMM: THE MOTE AND THE BEAM

A team of climate researchers and activists fail to disclose federal funding and scold climate sceptic Willie Soon for not disclosing funding

Not only do Koomey and Romm fail to disclose funding, they expressly state the opposite trying to morally berate a fellow scientist.

References:
† Defining a standard metric for electricity savings. Koomey J, Akbari H, Blumstein C et al Environ. Res. Lett. 5 (Jan-Mar 2010) 014017) 10.1088/1748-9326/5/1/014017


and the abstract of the paper in question.....

Abstract.?The growing investment by governments and electric utilities in energy efficiency programs highlights the need for simple tools to help assess and explain the size of the potential resource. One technique that is commonly used in this effort is to characterize electricity savings in terms of avoided power plants, because it is easier for people to visualize a power plant than it is to understand an abstraction such as billions of kilowatt-hours. Unfortunately, there is no standardization around the characteristics of such power plants.In this letter we define parameters for a standard avoided power plant that have physical meaning and intuitive plausibility, for use in back-of-the-envelope calculations. For the prototypical plant this article settles on a 500 MW existing coal plant operating at a 70% capacity factor with 7% T&D losses. Displacing such a plant for one year would save 3 billion kWh/year at the meter and reduce emissions by 3 million metric tons of CO2 per year.
The proposed name for this metric is the Rosenfeld, in keeping with the tradition among scientists of naming units in honor of the person most responsible for the discovery and widespread adoption of the underlying scientific principle in question—Dr Arthur H Rosenfeld.
Earth shatter.... Mind blower....
What a week argument but then again who would check to see what the paper is about? Not you or your team right OBD.
Big difference between a scientist for hire (Soon) for the fossil fuel companies to "make stuff up" then go to Congress and report it and a bunch of guy's trying to create a new metric called Rosenfeld....

You team is coming up short again.... but the fooled you didn't they... what does that make you?
 
See you side is at it again.
 

Attachments

  • image.jpg
    image.jpg
    77.6 KB · Views: 17
Look, more from your side.
 

Attachments

  • image.jpg
    image.jpg
    56 KB · Views: 23
Just a reminder. There has been no global warming for over the last 18 years.
Pretty much says everything about global warming forecasts.
 

Attachments

  • image.jpg
    image.jpg
    60.7 KB · Views: 22
← Obama Believes That All Weather Is Caused By Climate ChangeWarning! Avert Your Eyes →
Arctic Sea Ice Continues To Track 2006
Posted on March 4, 2015 by stevengoddard
For the past two years, Arctic sea ice has been tracking closely to 2006, which had the highest summer minimum of the past 11 years.

ScreenHunter_7675 Mar. 04 00.23 icecover_current (1)

There has been a huge increase in older/thicker ice over the past four years

myi2011-2014 (1)

what nonsense ..... your team just can't help making stuff up.
I see you are sniffing around steves gonnads again.
Lets see what the real data looks like.


Figure2.png


And here is what they say about the data.

Arctic sea ice extent in February averaged 14.41 million square kilometers (5.56 million square miles). This is the third lowest February ice extent in the satellite record. It is 940,000 square kilometers (362,900 square miles) below the 1981 to 2010 long-term average of 15.35 million square kilometers (5.93 million square miles). It is also 50,000 square kilometers (19,300 square miles) above the record low for the month observed in 2005.
With the Arctic Ocean completely ice covered, the remaining areas of potential new ice growth are limited to the margins of the pack in the northern Pacific and northern Atlantic. Sea ice extent is below average across the entire sea ice margin, most prominently along the Pacific sectors. A small region of above-average ice extent is located near Newfoundland and the Canadian Maritime Provinces.

The Arctic maximum is expected to occur in the next two or three weeks. Previous years have seen a surge in Arctic ice extent during March (e.g., in 2012, 2014). However, if the current pattern of below-average extent continues, Arctic sea ice extent may set a new lowest winter maximum.

http://nsidc.org/arcticseaicenews/

No wonder you have not a clue.......
 
Just a reminder. There has been no global warming for over the last 18 years.
Pretty much says everything about global warming forecasts.

Man up OBD

trend
 
Last edited by a moderator:
Why a pipeline debate won’t go away

Bloomberg Photo/Scott Dalton

Seven people on a stage will disagree a lot. If they’re talking Keystone XL, and whatever the pipeline’s fate means for Canada-U.S. relations, consensus won’t come easy. Someone will offer that the proposal’s underlying economic argument is strong and environmental concerns are misplaced, and others will disagree; someone will argue that fossil-fuel politics don’t mean much to day-to-day friendships and business relationships across the 49th parallel, and someone’s bound to think otherwise; and someone else will insist that everyone should stop dwelling on this pipeline already.

On March 3, in the wake of U.S. President Barack Obama’s veto of Keystone, Maclean’s and CPAC brought together a bi-national panel to talk about the future of Canada-U.S. relations with or without the pipeline. CPAC’s Peter Van Dusen moderated the panel, which featured Paul Wells, Maclean’s political editor; Luiza Ch. Savage, Maclean’s Washington bureau chief; Gary Doer, Canada’s ambassador to the United States; Sen. John Hoeven, of North Dakota; Former Rep. Bill Owens, of New York; and Danielle Droitsch, Canada Project Director at the Natural Resources Defense Council.

Differences of opinion aside, most panellists agreed about one thing: The leaders who live at 24 Sussex Dr. and 1600 Pennsylvania Ave. don’t get along right now, and that’s important. Maclean’s political editor Paul Wells, right at the top of the night, was first to mention Prime Minister Stephen Harper and Obama’s relationship—now widely agreed to be not wonderful, at least compared to certain of their predecessors.

Recall the noise made in the wake of Obama’s recent Keystone veto by Allan Gotlieb, Canada’s man in Washington for most of the 1980s, including the period when Ronald Reagan and Brian Mulroney got on famously. The so-called elder statesman of Canadian diplomats called the Harper-Obama relationship “as cool as I ever remember.”

That lack of camaraderie, said Maclean’s Washington bureau chief Luiza Ch. Savage, means the leaders can’t work on the big things, such as climate change, which Danielle Droitsch, the Canada Project Director at the Natural Resources Defense Council, said would be a useful place to start.

Gary Doer, Canada’s ambassador at the embassy next door to the Newseum where the panel unfolded, insisted that Canadians are willing to work co-operatively with Americans on mutual climate action—as when the two countries tackled acid rain during Gotlieb’s time in the same role. But Doer said there’s “no table,” i.e., no place to hash things out, despite a Canadian offer to find one and sit down. (“Try IKEA,” quipped Wells, to laughter from the audience.)

The American politicians on the panel, a Republican and a Democrat, disagreed—surprise!—about the pipeline’s greater meaning to cross-border relations. John Bernstein, the chief of staff to pro-Keystone Republican Sen. John Hoeven from North Dakota (and a last-minute fill-in for the under-the-weather senator), expressed some angst about lingering effects of pipeline politics.

No way will the pipeline’s fate mean that much, rebutted former Rep. Bill Owens, a pro-Keystone Democrat from New York whose old district borders Canada.

Eventually, the panel moved beyond Keystone—but the conversation returned repeatedly to the fraught pipeline. Doer, whose most recent letter to Secretary of State John Kerry urging Keystone’s approval was described by our magazine and others as “terse,” implored his panellists to agree that pipelines are safer than railways. He raised the spectre of a massive rail disaster—a Lac-Mégantic for the United States—as a moment that could, one scary day in the future, have anti-Keystone Americans rethinking their logic. Doer pointed to last week’s fireball in West Virginia that followed a derailment as a case in point. Reporting like this, from the New York Times after the West Virginia incident, tends to backstop Doer’s view:
Spills and fires in derailments have prompted concerns about the safety of transporting oil by rail. In 2011, the American Association of Railroads required that new tanker cars meet higher standards to resist rupture in accidents, though it did not require refitting older cars. CSX said the tankers in Monday’s crash had all been built to the new specifications.

Droitsch, who’s based in D.C. but lived in Canmore, Alta., for five years and knows the landscape north of the border, disagreed with any suggestion that a pipeline would remove oil from rails. Her NDRC colleague, Andrew Swift, made the same point in testimony to the House of Representatives in 2013 that differentiated between Bakken crude from North Dakota—where the trains in West Virginia and Lac-Mégantic originated—and that from northern Alberta:

From 2009 to 2013, transport of oil by rail in North Dakota increased from a few thousand barrels a day to over half a million. In January 2013, over two thirds of light crude produced in North Dakota was transported to refineries by rail. As they turned to rail, domestic light oil producers have even rejected major pipeline proposals, including Oenok’s 200,000-barrel-per-day Bakken pipeline. When analysts talk about the upsurge of rail transport in the United States and southern Canada, this is what they’re referring to—an enormous expansion of light crude from the Bakken.

However, a similar expansion has not occurred in Alberta’s tar sands, despite the need for additional transportation infrastructure. Data from the Energy Information Administration show that no more than 21,000 bpd of Canadian tar sands and conventional heavy crude—or less than 1 per cent of production—entered the United States via rail on its way to refinery markets in the Gulf Coast by rail in December 2012.

Doer fired back that oil exports by rail have increased 10-fold in recent years. Indeed, National Energy Board data track a substantial increase in crude exports by rail since 2012.

Quarter Volume (m³) Volume (m³ per day) Volume (bbl) Volume (bbl per day)
Q1 2012 (Jan-Mar) 231,086 2,539 1,454,191 15,980
Q2 2012 (Apr-Jun) 461,398 5,070 2,903,512 31,907
Q3 2012 (Jul-Sep) 837,081 9,099 5,267,630 57,257
Q4 2012 (Oct-Dec) 1,166,114 12,675 7,338,188 79,763
Q1 2013 (Jan-Mar) 1,510,737 16,786 9,506,850 105,632
Q2 2013 (Apr-Jun) 1,929,735 21,206 12,143,544 133,446
Q3 2013 (Jul-Sep) 1,809,418 19,668 11,386,409 123,765
Q4 2013 (Oct-Dec) 2,177,309 23,666 13,701,495 148,929
Q1 2014 (Jan-Mar) 2,363,453 26,261 14,872,875 165,254
Q2 2014 (Apr-Jun) 2,358,023 25,912 14,838,705 163,063
Q3 2014 (Jul-Sep) 2,661,655 28,931 16,749,414 182,059
The gregarious Doer and the data-driven Droitsch found little common ground. They even disagreed about the prospect of agreeing to disagree, but such is the clash between the Harper government’s strident lobbying for Keystone and environmental critics’ refusal to buy the hype.

Perhaps the pair will sit on the same stage in a few years and agree to agree about what Doer predicted would be the next big continental debate: water.

Below is the full recap of our panel:
 
Because you fail to read again.


They irony is Koomey and Romm’s actions are like Soon’s: failure to disclose funding to journal. Only in Soon’s case the funding agency stipulated non-disclosure in some instances and in others the journal had no policy or requirement for disclosure. Not only do Koomey and Romm fail to disclose funding, they expressly state the opposite trying to morally berate a fellow scientist.


and the abstract of the paper in question.....

Abstract.?The growing investment by governments and electric utilities in energy efficiency programs highlights the need for simple tools to help assess and explain the size of the potential resource. One technique that is commonly used in this effort is to characterize electricity savings in terms of avoided power plants, because it is easier for people to visualize a power plant than it is to understand an abstraction such as billions of kilowatt-hours. Unfortunately, there is no standardization around the characteristics of such power plants.In this letter we define parameters for a standard avoided power plant that have physical meaning and intuitive plausibility, for use in back-of-the-envelope calculations. For the prototypical plant this article settles on a 500 MW existing coal plant operating at a 70% capacity factor with 7% T&D losses. Displacing such a plant for one year would save 3 billion kWh/year at the meter and reduce emissions by 3 million metric tons of CO2 per year.
The proposed name for this metric is the Rosenfeld, in keeping with the tradition among scientists of naming units in honor of the person most responsible for the discovery and widespread adoption of the underlying scientific principle in question—Dr Arthur H Rosenfeld.
Earth shatter.... Mind blower....
What a week argument but then again who would check to see what the paper is about? Not you or your team right OBD.
Big difference between a scientist for hire (Soon) for the fossil fuel companies to "make stuff up" then go to Congress and report it and a bunch of guy's trying to create a new metric called Rosenfeld....

You team is coming up short again.... but the fooled you didn't they... what does that make you?
 
Because you fail to read again.


They irony is Koomey and Romm’s actions are like Soon’s: failure to disclose funding to journal. Only in Soon’s case the Fossil Fuel Company stipulated non-disclosure and all journals had a policy or requirement for disclosure. Bla Bla Bla Bla, Cry Cry Cry.


Here I fixed it for you.. now Man up...
 
Last edited by a moderator:
Why a pipeline debate won’t go away

<time class="timestamp" style="margin: 0px 0px 4px; padding: 0px; border: 0px; outline: 0px; vertical-align: baseline; font-family: 'Whitney SSm', sans-serif; display: block; line-height: 2.2rem; color: rgb(102, 102, 102); background-image: initial; background-attachment: initial; background-size: initial; background-origin: initial; background-clip: initial; background-position: 0px 0px; background-repeat: initial;">March 4, 2015 2:46 p.m. ET</time>WASHINGTON—An effort by Senate Republicans to override President Barack Obama’s veto of a bill approving the Keystone XL pipeline failed Wednesday, the latest twist in a lengthy saga over the contentious project.

http://www.wsj.com/articles/override-of-obamas-keystone-veto-fails-in-senate-1425498369

There I fixed it for you now man up.
 
Last edited by a moderator:
More nonsense from one of the stars of the climate change denial team.

HAC-Robust Measurement of the Duration of a Trendless Subsample in a Global Climate Time Series Ross R. McKitrick Department of Economics, University of Guelph, Guelph, Canada

Yea this Guy....
Ross McKitrick, Senior Fellow
Ross R. McKitrick is a Professor of Economics at the University of Guelph and Senior Fellow of the Fraser Institute. He specializes in environmental economics. He has published many studies on the economic analysis of pollution policy, economic growth and air pollution trends, climate policy options, the measurement of global warming, and statistical methods in paleoclimatology.
http://www.fraserinstitute.org/about-us/who-we-are/staff/senior-fellows.aspx

What a winner...... wonder who butters his toast...

http://dx.doi.org/10.4236/ojs.2014.47050

Conclusion:
I propose a robust definition for the length of the pause in the warming trend over the closing subsample of surface and lower tropospheric data sets. The length term MAX J is defined as the maximum duration J for which avalid (HAC-robust) trend confidence interval contains zero for every subsample beginning at J and ending atT m− where m is the shortest duration of interest. This definition was applied to surface and lower tropospheric temperature series, adding in the requirement that the southern and northern hemispheric data must yield an identical or larger value of MAX J . In the surface data we compute a hiatus length of 19 years, and in the lower tropospheric data we compute a hiatus length of 16 years in the UAH series and 26 years in the RSS series.MAX J estimates based on an AR1 estimator are lower but likely incorrect since higher-order autocorrelation exists in the data. Overall this analysis confirms the point raised in the IPCC report [1] regarding the existence of the hiatus and adds more precision to the understanding of its length.

trend


Well there you go OBD you can now say the "paws" is 26 years.... LOL
Matter of fact I think you have your new marching orders...
What a effed up team your sides is....
 
Last edited by a moderator:
You missed this as well.


The IPCC has drawn attention to an apparent leveling-off of globally-averaged temperatures over the past 15 years or so. Measuring the duration of the hiatus has implications for determining if the underlying trend has changed, and for evaluating climate models. Here, I propose a method for estimating the duration of the hiatus that is robust to unknown forms of heteroskedasticity and autocorrelation (HAC) in the temperature series and to cherry-picking of endpoints. For the spe- cific case of global average temperatures I also add the requirement of spatial consistency between hemispheres. The method makes use of the Vogelsang-Franses (2005) HAC-robust trend variance estimator which is valid as long as the underlying series is trend stationary, which is the case for the data used herein. Application of the method shows that there is now a trendless interval of 19 years duration at the end of the HadCRUT4 surface temperature series, and of 16 - 26 years in the lower troposphere. Use of a simple AR1 trend model suggests a shorter hiatus of 14 - 20 years but is likely unreliable.


More nonsense from one of the stars of the climate change denial team.

HAC-Robust Measurement of the Duration of a Trendless Subsample in a Global Climate Time Series Ross R. McKitrick Department of Economics, University of Guelph, Guelph, Canada

Yea this Guy....


What a winner...... wonder who butters his toast...


trend


Well there you go OBD you can now say the "paws" is 26 years.... LOL
Matter of fact I think you have your new marching orders...
What a effed up team your sides is....
 
Status
Not open for further replies.
Back
Top