
You are using an out of date browser. It may not display this or other websites correctly.
You should upgrade or use an alternative browser.
You should upgrade or use an alternative browser.
Climate: LNG in B.C. vs Alberta tarsands
- Thread starter Foxsea
- Start date
- Status
- Not open for further replies.
GLG
Well-Known Member
Look's like old Steve's Gonnads has a twitter account.
This should be fun to follow and post to.....")
https://twitter.com/HellerExposed
This should be fun to follow and post to.....
https://twitter.com/HellerExposed
Last edited by a moderator:
OldBlackDog
Well-Known Member
Another Couple of Notes about Michael Mann’s “Faux Pause” Post and Steinman et al. 2015
Guest Post by Bob Tisdale
We discussed Steinman et al. (2015) and Michael Mann’s post about it at RealClimate in the article On Steinman et al. (2015) – Michael Mann and Company Redefine Multidecadal Variability And Wind Up Illustrating Climate Model Failings. This brief post adds to that discussion.
THE PAUSE, HIATUS, SLOWDOWN (WHATEVER) IN GLOBAL WARMING IS MORE PREVALENT IN THE SOUTHERN HEMISPHERE, YET MANN AND STEINMAN ET AL. FOCUSED ON THE NORTHERN HEMISPHERE
The opening paragraph in Michael Mann’s post at RealClimate reads:
No, climate change is not experiencing a hiatus. No, there is not currently a “pause” in global warming.
The initial topic of discussion is GLOBAL warming…and Mann’s perception that there is no pause in the surface temperatures GLOBALLY.
Yet Mann in his blog post and Steinman et al. have redirected the discussion from global warming to Northern Hemisphere warming. That is, Steinman et al. (2015) was not an examination of the modeled and observed surface temperatures globally. Their paper only looked at the surface temperatures of the Northern Hemisphere, and the sea surface temperatures of the North Atlantic and North Pacific. Mann even notes this a few paragraphs later, where he opens the paragraph with:
We focused on the Northern Hemisphere…
But it’s well known that the hiatus, the pause, the slowdown, etc., in surface warming is more prevalent in the Southern Hemisphere than in the Northern Hemisphere. If you aren’t aware of that fact, I’ll show you.
The year 1998 is commonly used for the start of the global warming slowdown, and Kevin Trenberth used 2001 in his article Has Global Warming Stalled? for the Royal Meteorological Society. (Also see my post Open Letter to the Royal Meteorological Society Regarding Dr. Trenberth’s Article “Has Global Warming Stalled?”.) So we’ll present the data with both start years. For the data, we’ll present the widely referenced, spatially complete GISS Land-Ocean Temperature Index (LOTI) data.
Figure 1 compares the Northern and Southern Hemisphere surface temperature anomalies during the hiatus. In the top cell, the data start in 1998, and in the bottom cell, the data start in 2001. As noted earlier, the slowdown in surface warming is more prevalent in the Southern Hemisphere.
Figure 1
Figure 1
And for those interested, Figures 2 and 3 present model-data comparisons for the Northern (Figure 2) and Southern (Figure 3) Hemispheres for the two slowdown periods. The models are represented by the multi-model mean of all of the climate models stored in the CMIP5 archive, with historic forcings through 2005 and RCP8.5 scenario forcings thereafter. The data and the model outputs are available through the KNMI Climate Explorer. We present the multi-model mean because it best represents the consensus, the groupthink, on how surface temperatures should have warmed if they were warmed by manmade greenhouse gases and the other forcings. In other words, the model mean represents the forced component of the models. For additional information on the use of the model mean, see the post here. (Also see the discussion of Estimates of the forced component under the heading of Materials and Methods in the Supplementary Material furnished with Steinman et al.)
Figure 2
Figure 2
# # #
Figure 3
Figure 3
It appears that Michael Mann may have biased his opinions about the slowdown in global surface warming by looking only at data for the Northern Hemisphere, which shows higher warming rates than the Southern Hemisphere. One only has to look at trend maps of the global warming slowdown periods in Figure 4 to see that there is less warming in the Southern Hemisphere. (The trend maps are available from the GISS map-making webpage.)
Figure 4
Figure 4
CLOSING
The Steinman et al. (2015) analyses do not explain the slowdown and stoppage of surface warming in the Southern Hemisphere…and, as noted in the earlier post, they had to redefine multidecadal temperature variability to try to explain it in the Northern Hemisphere.
SOURCE
The GISS LOTI data and the climate model outputs are available from the KNMI Climate Explorer.
OldBlackDog
Well-Known Member
State of the Sea Ice – February 2015
Guest essay by Robert A Cook, PE
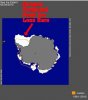
clip_image001
Sea ice concentration, north and south poles as observed by satellite. Image from University of Illinois Cryosphere Today
In particular, for the twenty-second of each month, we will calculate and present for discussion:
that day’s solar radiation level at top of atmosphere (TOA),
that day’s declination angle (the tilt of the earth’s axis towards or away from the solar plane),
that day’s average Antarctic and Arctic sea ice area and extents,
an estimate of the latitude of the edge of that day’s Antarctic and Arctic areas,
at the edge of the sea ice for that day, estimate the total reflected and absorbed solar radiation into open water and sea ice for a clear day. (This requires an estimate of the sea ice albedo for that day, the solar elevation of the sun for each hour of that day, an estimate of the open ocean water albedo each hour at each solar elevation angle, and an estimate of the atmosphere’s clarity that day, and the air mass attenuating the sun’s energy each hour of that day at that latitude. )
an estimate of the average additional heat losses each hour on that day from the open ocean and from the sea ice.
Summary
The Antarctic sea ice continues to be far above average for this time of year: rising from +23% Feb 1 to 33.4% Feb 28. This DOES matter, because the excess Antarctic sea ice this time of year reflects significant amounts of sunlight, and this loss continues to cool the planet. A lot.”
“The Arctic sea ice remains slightly below average for this time of year at -7%. It doesn’t matter. There is almost no sunlight hitting the Arctic sea ice at this time of year. However, losing this Arctic sea ice cools the planet now, which often leads to additional Arctic sea ice area later in the year, which can reflect more sunlight then, then – again – cooling the planet.
I appreciate Anthony’s patience in delivering this report several days after Feb 22. As an excuse, I could claim that I needed the Cryosphere to process its data for the 22nd, or to claim that I was waiting breathlessly for the Antaractic sea ice minimum to pass (finally! Minimum looks like it happened 28 Feb, based on Cryosphere increases reported 2-3 March), but we should all be humble as we observe the planet. Its schedule does not recognize our months and days and hours.
Antarctica first?
As usual, Antarctic sea ice goes first for several reasons.
First, it is almost always ignored by the CAGW press agents because the Antarctic sea ice reflects badly on several of their predictions about the effects of CO2 in particular and global warming in general. As observers of the global warming debate, you need to know what is happening all over, not just what the press agents want you to know, and what they don’t want you to know.
We will continue to show through the next few months just how much more important the Antarctic sea ice area actually is to the world’s heat balance: The much-hyped Arctic amplification is a very real effect. But it does NOT only occur in the limited area of the Arctic (where sea ice has been receding for several decades) but around the unlimited seas and ever-increasing sea ice surrounding the Antarctica. Down south, where the sun is always higher in the sky and the solar energy reflected back into space much greater, sea ice area really does matter.
Up north? Not so much 9 months of the year.
22 February 2015, Day-of-Year (DOY) = 053
Antarctic Sea Ice Area (SIA)
The Antarctic sea ice continued to melt through February as sea ice area decreased towards its usual its summer minimum. The Antarctic sea ice anomaly remained positive all month (more sea ice than “normal” for every day in February. The Antarctic sea ice anomaly itself decreased during the month, even though the percent of excess sea ice increased. At 0.618 Mkm^2 on 22 Feb, this “excess” sea ice is now represents a reflecting surface about half the size of Hudson’s Bay, at a latitude slightly further north than Hudson’s Bay.
The Antarctic sea ice has been more than 2 standard deviations above normal for almost every day of the past 2-1/2 years now, and February 2015 only continues that trend towards more sea ice.
SIA 1979-2008, DOY 22, = 1.874 Mkm^2, Average area this date
SIA 2015, DOY 22, = 2.492 Mkm^2, Actual area this date
SIA Anomaly, 2015, DOY 22 = 0.618 Mkm^2, Anomaly this date
Percent increase of Antarctic SIA = 33.0% more Antarctic sea ice than normal for this date
Today’s total Antarctic Ice = 14.0 + 1.5 + 2.492 = 18.0 Mkm^2.
The edge of the Antarctic sea ice is at latitude -68.3 south, slightly closer to the South Pole than the Antarctic Circle at -66.5 south latitude.
(Antarctica’s ice now covers a total area of 18.0 Mkm^2 = 14.0 mkm^2 of continental land ice + 1.5 Mkm^2 of permanent shelf ice plus 2.5 Mkm^2 of total sea ice.) Today’s Antarctic sea ice area represents Antarctica’s annual minimum area.
General Observations: The Antarctic sea ice completed its annual retreat towards the minimum sea ice area in 27-28 February, DOY = 57-58. This year’s minimum was no single sharp “point” but rather a slow flattening of the sea ice area over the last 13 days. You can never predict everything about the sea ice, but it is certainly expected to continue growing from now (2 March) through September’s maximum of 16+ million sq kilometers.
Below, the 1979-2010 avearge Antarctcic sea ice measurements are in green, this year’s actual measurements are in red. The Antarctic sea ice area anomalies are below in blue.
clip_image003
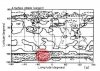
The remaining sea ice tends to be very close to the Antarctic land mass. The large open area (polynaya) in the Ross Sea region in January expanded somewhat, but the “ice island” offshore remained intact. This open area between the edge of the sea ice and the Antarctic continent mass is somewhat unusual, but the open water is expected to re-freeze shortly as air temperatures continue to decline. Most of the time in most years, the Antarctic sea ice lies right up close to the coastline, with the sea ice touching the coast (grounded on the beaches) called “fast ice”. (It is held fast by the land.)
Antarctic Sunlight, DOY = 53.
Solar radiation at Top of Atmosphere (TOA) = 1390 watt/m^2 this date (whole earth exposure) based on a yearly average TSI = 1362 watts/m^2. As it always does, solar radiation at TOA will continue to decrease from its yearly maximum of 1407 watts/m^2 on January 5 to its yearly minimum of 1315 watts/m^2 July 5. As far as the total planet heat balance goes, this means each day-of-year later means the sea ice at each pole will be able to reflect less and less between now and July 5.
Declination Angle on Feb 22 was = -0.183 radians/-10.48 degrees, Tau (the Day Angle) = 0.90
We are still in the Antarctic summer, but February represents late summer – compare it to early August up north. (Australian and South African readers do not need a summer-winter conversion table.)
At the edge of the Antarctic sea ice, at -68.0 latitude, sunrise occurred before 05:00 AM on Feb 22, sunset was 14 hours later after 19:00 PM.
At noon, at -68.0 latitude, air mass = 1.867; direct sunlight on a perpendicular surface = 813 watts/m^2 (Direct radiation on Feb 22 is down from January 22 due to increased air mass (greater attenuation), lower TOA radiation, and a slightly higher latitude of the sea ice edge. All as expected, since Feb 22 is later in the solar year, is right near the point of the annual minimum point for Antarctic sea ice, and has fewer hours of sunlight.)
At noon today, peak radiation on the sea surface = 434 watts/m^2 at a 32.3 solar elevation angle
At noon today under clear skies, the Antarctic Sea Ice albedo = 0.750: of the 434 watts hitting every sq meter of “excess” sea ice, 109 watts are absorbed, and 326 watts are reflected into space.
At noon today under clear skies at 32.3 SEA, the Open ocean albedo = 0.069: of the 434 watts hitting open ocean at the sea ice edge, 404 would be absorbed, and only 30 watts reflected.
Today, this day of year, from each and every “excess” meter of Antarctic sea ice, you can see that an “excess” of 294 watts/m^2 are reflected back into space (326 watts/m^2 – 30 watts/m^, clear day, at noon).
Well, “sunlight” occurs for 14 of the 24 hours down south at latitude -68.0 today, so it’s better to total the 14 hours that the sun is above the horizon. (We’ll compare this value later to what little sunlight is available up north.)
DIR_Rad Horiz. Hour DIR Ocean Albedo Dir Ocean Absorbed Dir Ocean Reflected Dir Ice Absorbed Dir Ice Reflected
0 0.00 0.000 0 0 0 0
0 1.00 0.000 0 0 0 0
0 3.00 0.000 0 0 0 0
3 5.00 0.682 1 2 1 2
44 6.00 0.352 29 15 11 33
124 7.00 0.205 98 25 31 93
216 8.00 0.137 187 30 54 162
304 9.00 0.101 273 31 76 228
374 10.00 0.082 343 31 93 280
419 11.00 0.072 389 30 105 314
434 12.00 0.069 404 30 109 326
418 13.00 0.072 388 30 105 314
373 14.00 0.082 342 31 93 280
302 15.00 0.102 271 31 76 227
214 16.00 0.138 185 30 54 161
121 17.00 0.208 96 25 30 91
42 18.00 0.359 27 15 11 32
3 19.00 0.698 1 2 1 2
0 21.00 0.000 0 0 0 0
0 23.00 0.000 0 0 0 0
3391 3391 3034 357 848 2543
Delta: 2186 2186
Guest essay by Robert A Cook, PE
clip_image001
Sea ice concentration, north and south poles as observed by satellite. Image from University of Illinois Cryosphere Today
In particular, for the twenty-second of each month, we will calculate and present for discussion:
that day’s solar radiation level at top of atmosphere (TOA),
that day’s declination angle (the tilt of the earth’s axis towards or away from the solar plane),
that day’s average Antarctic and Arctic sea ice area and extents,
an estimate of the latitude of the edge of that day’s Antarctic and Arctic areas,
at the edge of the sea ice for that day, estimate the total reflected and absorbed solar radiation into open water and sea ice for a clear day. (This requires an estimate of the sea ice albedo for that day, the solar elevation of the sun for each hour of that day, an estimate of the open ocean water albedo each hour at each solar elevation angle, and an estimate of the atmosphere’s clarity that day, and the air mass attenuating the sun’s energy each hour of that day at that latitude. )
an estimate of the average additional heat losses each hour on that day from the open ocean and from the sea ice.
Summary
The Antarctic sea ice continues to be far above average for this time of year: rising from +23% Feb 1 to 33.4% Feb 28. This DOES matter, because the excess Antarctic sea ice this time of year reflects significant amounts of sunlight, and this loss continues to cool the planet. A lot.”
“The Arctic sea ice remains slightly below average for this time of year at -7%. It doesn’t matter. There is almost no sunlight hitting the Arctic sea ice at this time of year. However, losing this Arctic sea ice cools the planet now, which often leads to additional Arctic sea ice area later in the year, which can reflect more sunlight then, then – again – cooling the planet.
I appreciate Anthony’s patience in delivering this report several days after Feb 22. As an excuse, I could claim that I needed the Cryosphere to process its data for the 22nd, or to claim that I was waiting breathlessly for the Antaractic sea ice minimum to pass (finally! Minimum looks like it happened 28 Feb, based on Cryosphere increases reported 2-3 March), but we should all be humble as we observe the planet. Its schedule does not recognize our months and days and hours.
Antarctica first?
As usual, Antarctic sea ice goes first for several reasons.
First, it is almost always ignored by the CAGW press agents because the Antarctic sea ice reflects badly on several of their predictions about the effects of CO2 in particular and global warming in general. As observers of the global warming debate, you need to know what is happening all over, not just what the press agents want you to know, and what they don’t want you to know.
We will continue to show through the next few months just how much more important the Antarctic sea ice area actually is to the world’s heat balance: The much-hyped Arctic amplification is a very real effect. But it does NOT only occur in the limited area of the Arctic (where sea ice has been receding for several decades) but around the unlimited seas and ever-increasing sea ice surrounding the Antarctica. Down south, where the sun is always higher in the sky and the solar energy reflected back into space much greater, sea ice area really does matter.
Up north? Not so much 9 months of the year.
22 February 2015, Day-of-Year (DOY) = 053
Antarctic Sea Ice Area (SIA)
The Antarctic sea ice continued to melt through February as sea ice area decreased towards its usual its summer minimum. The Antarctic sea ice anomaly remained positive all month (more sea ice than “normal” for every day in February. The Antarctic sea ice anomaly itself decreased during the month, even though the percent of excess sea ice increased. At 0.618 Mkm^2 on 22 Feb, this “excess” sea ice is now represents a reflecting surface about half the size of Hudson’s Bay, at a latitude slightly further north than Hudson’s Bay.
The Antarctic sea ice has been more than 2 standard deviations above normal for almost every day of the past 2-1/2 years now, and February 2015 only continues that trend towards more sea ice.
SIA 1979-2008, DOY 22, = 1.874 Mkm^2, Average area this date
SIA 2015, DOY 22, = 2.492 Mkm^2, Actual area this date
SIA Anomaly, 2015, DOY 22 = 0.618 Mkm^2, Anomaly this date
Percent increase of Antarctic SIA = 33.0% more Antarctic sea ice than normal for this date
Today’s total Antarctic Ice = 14.0 + 1.5 + 2.492 = 18.0 Mkm^2.
The edge of the Antarctic sea ice is at latitude -68.3 south, slightly closer to the South Pole than the Antarctic Circle at -66.5 south latitude.
(Antarctica’s ice now covers a total area of 18.0 Mkm^2 = 14.0 mkm^2 of continental land ice + 1.5 Mkm^2 of permanent shelf ice plus 2.5 Mkm^2 of total sea ice.) Today’s Antarctic sea ice area represents Antarctica’s annual minimum area.
General Observations: The Antarctic sea ice completed its annual retreat towards the minimum sea ice area in 27-28 February, DOY = 57-58. This year’s minimum was no single sharp “point” but rather a slow flattening of the sea ice area over the last 13 days. You can never predict everything about the sea ice, but it is certainly expected to continue growing from now (2 March) through September’s maximum of 16+ million sq kilometers.
Below, the 1979-2010 avearge Antarctcic sea ice measurements are in green, this year’s actual measurements are in red. The Antarctic sea ice area anomalies are below in blue.
clip_image003
The remaining sea ice tends to be very close to the Antarctic land mass. The large open area (polynaya) in the Ross Sea region in January expanded somewhat, but the “ice island” offshore remained intact. This open area between the edge of the sea ice and the Antarctic continent mass is somewhat unusual, but the open water is expected to re-freeze shortly as air temperatures continue to decline. Most of the time in most years, the Antarctic sea ice lies right up close to the coastline, with the sea ice touching the coast (grounded on the beaches) called “fast ice”. (It is held fast by the land.)
Antarctic Sunlight, DOY = 53.
Solar radiation at Top of Atmosphere (TOA) = 1390 watt/m^2 this date (whole earth exposure) based on a yearly average TSI = 1362 watts/m^2. As it always does, solar radiation at TOA will continue to decrease from its yearly maximum of 1407 watts/m^2 on January 5 to its yearly minimum of 1315 watts/m^2 July 5. As far as the total planet heat balance goes, this means each day-of-year later means the sea ice at each pole will be able to reflect less and less between now and July 5.
Declination Angle on Feb 22 was = -0.183 radians/-10.48 degrees, Tau (the Day Angle) = 0.90
We are still in the Antarctic summer, but February represents late summer – compare it to early August up north. (Australian and South African readers do not need a summer-winter conversion table.)
At the edge of the Antarctic sea ice, at -68.0 latitude, sunrise occurred before 05:00 AM on Feb 22, sunset was 14 hours later after 19:00 PM.
At noon, at -68.0 latitude, air mass = 1.867; direct sunlight on a perpendicular surface = 813 watts/m^2 (Direct radiation on Feb 22 is down from January 22 due to increased air mass (greater attenuation), lower TOA radiation, and a slightly higher latitude of the sea ice edge. All as expected, since Feb 22 is later in the solar year, is right near the point of the annual minimum point for Antarctic sea ice, and has fewer hours of sunlight.)
At noon today, peak radiation on the sea surface = 434 watts/m^2 at a 32.3 solar elevation angle
At noon today under clear skies, the Antarctic Sea Ice albedo = 0.750: of the 434 watts hitting every sq meter of “excess” sea ice, 109 watts are absorbed, and 326 watts are reflected into space.
At noon today under clear skies at 32.3 SEA, the Open ocean albedo = 0.069: of the 434 watts hitting open ocean at the sea ice edge, 404 would be absorbed, and only 30 watts reflected.
Today, this day of year, from each and every “excess” meter of Antarctic sea ice, you can see that an “excess” of 294 watts/m^2 are reflected back into space (326 watts/m^2 – 30 watts/m^, clear day, at noon).
Well, “sunlight” occurs for 14 of the 24 hours down south at latitude -68.0 today, so it’s better to total the 14 hours that the sun is above the horizon. (We’ll compare this value later to what little sunlight is available up north.)
DIR_Rad Horiz. Hour DIR Ocean Albedo Dir Ocean Absorbed Dir Ocean Reflected Dir Ice Absorbed Dir Ice Reflected
0 0.00 0.000 0 0 0 0
0 1.00 0.000 0 0 0 0
0 3.00 0.000 0 0 0 0
3 5.00 0.682 1 2 1 2
44 6.00 0.352 29 15 11 33
124 7.00 0.205 98 25 31 93
216 8.00 0.137 187 30 54 162
304 9.00 0.101 273 31 76 228
374 10.00 0.082 343 31 93 280
419 11.00 0.072 389 30 105 314
434 12.00 0.069 404 30 109 326
418 13.00 0.072 388 30 105 314
373 14.00 0.082 342 31 93 280
302 15.00 0.102 271 31 76 227
214 16.00 0.138 185 30 54 161
121 17.00 0.208 96 25 30 91
42 18.00 0.359 27 15 11 32
3 19.00 0.698 1 2 1 2
0 21.00 0.000 0 0 0 0
0 23.00 0.000 0 0 0 0
3391 3391 3034 357 848 2543
Delta: 2186 2186
Attachments

OldBlackDog
Well-Known Member
As this is long, the full article is here.
http://wattsupwiththat.com/2015/03/05/state-of-the-sea-ice-february-2015/
http://wattsupwiththat.com/2015/03/05/state-of-the-sea-ice-february-2015/
GLG
Well-Known Member
We The People Petition Titled:
Nominate Willard Anthony Watts as the next Chair of the Intergovernmental Panel On Climate Change.
“The Intergovernmental Panel on Climate Change, an organization created by the World Meteorological Organization and the United Nations Environmental Programme, will elect a new chair this year. The post is currently being filled by an interim chair following the resignation of Rajendra Pachauri.
The United States has currently nominated Dr. Christopher Field. We petition the current administration to withdraw his nomination and instead nominate Willard Anthony Watts.
Willard Anthony Watts is an American TV meteorologist who runs the blog Watts Up With That? which is billed as “The world’s most viewed site on global warming and climate change”. His understanding of the science and related policy issues make him a better choice for American Fossil Fuel interests.”
http://wh.gov/ijHfm
GLG
Well-Known Member
State of the Sea Ice – February 2015
Guest essay by Robert A Cook, PE
clip_image001
Sea ice concentration, north and south poles as observed by satellite. Image from University of Illinois Cryosphere Today
In particular, for the twenty-second of each month, we will calculate and present for discussion:
Or we can look to our own Arctic and get Nature's take on your argument.
Starting to see a trend yet OBD?

OldBlackDog
Well-Known Member
Just a reminder for you. I am sure you read the article posted.
The Antarctic sea ice continues to be far above average for this time of year: rising from +23% Feb 1 to 33.4% Feb 28. This DOES matter, because the excess Antarctic sea ice this time of year reflects significant amounts of sunlight, and this loss continues to cool the planet. A lot.”
“The Arctic sea ice remains slightly below average for this time of year at -7%. It doesn’t matter. There is almost no sunlight hitting the Arctic sea ice at this time of year. However, losing this Arctic sea ice cools the planet now, which often leads to additional Arctic sea ice area later in the year, which can reflect more sunlight then, then – again – cooling the planet.
Or we can look to our own Arctic and get Nature's take on your argument.
Starting to see a trend yet OBD?
GLG
Well-Known Member
Just a reminder for you. I am sure you read the article posted.
The Antarctic sea ice continues to be far above average for this time of year: rising from +23% Feb 1 to 33.4% Feb 28. This DOES matter, because the excess Antarctic sea ice this time of year reflects significant amounts of sunlight, and this loss continues to cool the planet. A lot.”
“The Arctic sea ice remains slightly below average for this time of year at -7%. It doesn’t matter. There is almost no sunlight hitting the Arctic sea ice at this time of year. However, losing this Arctic sea ice cools the planet now, which often leads to additional Arctic sea ice area later in the year, which can reflect more sunlight then, then – again – cooling the planet.
Nonsense....
Here is your argument.
Because 300,000 kids are overweight therefore 1,000,000 starving kids are fine.
Look at the numbers
OldBlackDog
Well-Known Member
OldBlackDog
Well-Known Member
Junk Science Week 2015: Time for post-Pachauri reform at IPCC | Financial Post
cracked-beaker3Excerpted from Climate Etc., hosted by Judith Curry, Professor and former Chair of the School of Earth and Atmospheric Sciences at the Georgia Institute of Technology. Ms. Curry is one of several U.S. scientists singled out by a U.S. Congressman for investigation. Ms.Curry here comments on the resignation of Rachendra Pachauri as chair of the Intergovernmental Panel on Climate Change, (IPCC) and its impact on global climate science and policy
Rachendra Pachauri, IPCC Chair since 2002, has resigned from his position. His resignation was triggered by charges of molestation, stalking and sexual harassment. Pachauri’s defense is that his email accounts, mobile phone, and messages have been hacked. His arrest in India has been delayed owing to Pachauri’s hospitalization for a heart condition and UTI.
So, what does all this mean for the IPCC? Are the peccadilloes and trials of an individual – Pachauri – capable of adversely impacting the reputation of the IPCC and the forthcoming policy negotiations in Paris?
Inside Climate News argues that the credibility of the IPCC and negotiations in Paris will not suffer. On the other hand, the Telegraph writes: “He may now finally have gone, but the damage he did to the IPCC’s credibility as a serious scientific body is irreparable.”
National Post
Donna LaFramboise highlights what I regard as the most serious issue for the IPCC’s reputation.From Pachauri’s resignation letter: “For me the protection of Planet Earth, the survival of all species and sustainability of our ecosystems is more than a mission. It is my religion and my dharma.”
With the Paris summit looming in December, the credibility of the IPCC would seem to be important, although the United Nations Framework Convention on Climate Change (UNFCCC) seems to be about raw politics and I’m not sure how relevant the IPCC is any more.
In 2013 I wrote: “Diagnosis: paradigm paralysis, caused by motivated reasoning, oversimplification, and consensus seeking; worsened and made permanent by a vicious positive feedback effect at the climate science-policy interface.”
Perhaps the Pachauri scandal will jolt the IPCC out of its paralysis. Hopefully a new Chair can provide the impetus for torqueing the IPCC in a better direction. I am not optimistic, but there is a window of opportunity here.
The IPCC needs to regain its scientific objectivity. [IPCC Working Group 1] needs to begin addressing natural variability in a more serious and comprehensive manner. If the model projections and observations of surface temperature continue to diverge [see graph], continued high confidence in attribution and future projections will become ludicrous. The IPCC should abandon its consensus seeking approach and do a more serious job of assessing uncertainties, ambiguities and areas of ignorance.
The issue of conflict of interest is a critical one – not just financial and political conflicts, but conflicts associated with lead authors assessing their own research. A serious effort at identifying conflicts and managing them would go a long way towards rebuilding the credibility.
Attachments
GLG
Well-Known Member
Junk Science Week 2015: Time for post-Pachauri reform at IPCC | Financial Post
I see you can't win on the science so you will try on the smear.
Typical of you OBD
Time to Man up OBD
Last edited by a moderator:
C
ClayoquotKid
Guest
Well done CK.
Like I said Bunken is trying to give us the impression that Climate Models are based on Bode equations when they are not. They used Bode to compare some of the models and that is all they did. Don't forget that was 2007. I have not looked in IPCC 2013 so I don't know if they still do the same thing.
Bolt it on or apply it makes no difference he still wants to argue that sensitivity is low. That's not working out in the real world as the Arctic Ice cap is showing us. As you may know we are at 400 ppm and the doubling number is 450 ppm. Unless things change we will be at 450 ppm in 25 to 30 years. So it makes a difference what the sensitivity is. The way I see it this whole Bode thing is a red herring and a distraction from the real issue. If sensitivity is low, like bunken wants, then we have few extra (20 or 30) years before we reach 2C if it's high then it will be at 2C in less time and we wont have to wait 25 to 30 years and 450 ppm.

http://pubs.giss.nasa.gov/docs/1984/1984_Hansen_etal_1.pdf
There you go.
Hansen's paper, where he states, "We use procedures and terminology of feedback studies in electronics (Bode, 1945) to help analyse the contributions of different feedback processes."
He (Monkton) does want to argue that sensitivity is low, and by pointing out where climate models use an inapproriate method in defining sensitivity through feedbacks - he does a pretty good job IMHO.
OldBlackDog
Well-Known Member
Don't forget to say why I have to man up.
Your side seems to be loosing not mine.
Your side seems to be loosing not mine.
GLG
Well-Known Member
View attachment 16580
http://pubs.giss.nasa.gov/docs/1984/1984_Hansen_etal_1.pdf
There you go.
Hansen's paper, where he states, "We use procedures and terminology of feedback studies in electronics (Bode, 1945) to help analyse the contributions of different feedback processes."
He (Monkton) does want to argue that sensitivity is low, and by pointing out where climate models use an inapproriate method in defining sensitivity through feedbacks - he does a pretty good job IMHO.
Models from 1984 may have had it like you suggest but I don't think they are in use any more...
Just like I don't use my IBM XT.....

Still trying to get through the 2013 IPCC report on models. So far I don't see any Bode in there.
I still think it's a red herring as the interesting part is his simple climate model.
Like I said I could see some value in it if he removed the errors (cherry pick data)
What do you think about his cherry picking the data to get the numbers to come out with such a low sensitivity?
Would that not make his conclusions wrong?
OldBlackDog
Well-Known Member
Global warming: 10 reasons to be sceptical
Referenced version of an article published in the Dominion Post on 5 March 2015 entitled “Hypothetical global warming: scepticism needed”
We are constantly told that man-made carbon dioxide has caused global warming that will bring doom and disaster in a few years. These predictions are largely based on the output of computer models, rather than observations of what is happening in the real world. Always remember the parental advice: “Believe nothing of what you hear and half of what you see”. One should always be sceptical and, in science, nothing is more important.
Here are 10 reasons why the public should be cautious of the hypothesis that man-made carbon dioxide causes dangerous global warming.
1. The five internationally accepted temperature records – three surface and two satellite – show that the world has not experienced any significant warning over the last 18 years even though atmospheric carbon dioxide increased by 10%. Claims that 2014 was the warmest year don’t mention that the increase in temperature was a miniscule 0.02° and the more accurate satellite records show that it was not the warmest year.
111 of the IPCC’s 114 climate model runs failed to predict this lack of warming. In most branches of science, when the theoretical predictions do not line up with the observations, the hypothesis is abandoned. In climate science, the observations are discounted or ignored. We can now be confident that man-made carbon dioxide does not cause dangerous global warming and that the predictions of computer models of the climate are worthless. (1)
2. Global sea ice area is well above the 1979 – 2013 average. In the Arctic it is close to average extent and in the Antarctic it is at the highest level since 1979. Once again, there is a large disparity between the computer based predictions of ever increasing loss of sea ice and reality. (2)
3. Sea levels are rising steadily at between 1 and 3 mm per year as they have done for the last 100 years. According to satellite measurements it rose at 4.1 mm per year from 1996 to 2006 but only 2.75 mm per year from 2006 to 2014. In New Zealand, tectonic movements have a far greater influence on sea levels. (3)
4. Polar bear populations have increased from about 5000 to 25,000 since hunting was restricted in 1970. A population that can recover that quickly in spite of 700 per year still being hunted can hardly be threatened. Various experts claim that the population is now increasing, steady, or decreasing. Take your pick. (4)
5. Coral atolls are not disappearing beneath rising oceans. The highly accurate tide gauge at Tuvalu shows that sea level rise is minimal. Tuvalu certainly does have problems, but they are not due to rapidly rising sea levels. 15,000 years ago sea levels were rising at 3 m per century and coral atolls and the Great Barrier reef survived this rapid rise thus proving that they can cope with rapid sea level rise. (5)
6. Glaciers are retreating in some areas and advancing in others but we do know that 5000 years ago the European Alps had less ice than now and the Canadian tree line lay further north. It has all happened before! (6)
7. Historical records show that the world was warmer during the Middle Ages Warm Period. This is supported by many peer-reviewed papers and recent records from fossil giant clams in the Pacific Ocean. Warming in the Bronze, Roman and Middle Ages Warm periods led to prosperity and progress. (7)
OldBlackDog
Well-Known Member
8. Ocean “acidification” is supposed to be a dire threat to marine life. In fact, the ocean is alkaline and is at no more risk of becoming acidic than you would get from putting a teaspoonful of sulphuric acid into a bucket of caustic soda. Recent analysis indicates that the ocean has become more alkaline since 1910 and that there are quite large fluctuations in the short term. (8)
9. Plants cannot grow without carbon dioxide and the increased levels of carbon dioxide have boosted plant growth worldwide by 11%without the need for additional water. The agricultural benefit to the world is valued at trillions of dollars. Modern greenhouses burn natural gas to double the carbon dioxide concentration and hence increase production by 40%. (10)
10. Droughts, floods and cyclones are often claimed to have increased because of global warming. But an IPCC study shows that the frequency of droughts has hardly changed and cyclones have declined. (9)
What can we expect in the future? The only honest answer is that nobody knows. The British Meteorological Office has predicted that the present lack of warming will continue until 2018 at least. Scientists who study natural climate cycles and the effect of the sun and sunspot cycles on the climate believe that there is a high probability that the world has – or soon will – enter a cooling cycle. If this happens and history repeats itself, we will be faced with famine, disease and war.
Most mainstream climate scientists agree that 2° of warming would not be harmful so let us hope that temperatures stay constant – which is most unlikely – or warm enough to get us back into the situation during the Middle Ages Warm Period.
The obvious conclusion is that the science is not settled. As Dr Pachauri, Chairman of the IPCC, stated in a recent interview, open debate is needed.(11)
The media needs to start encouraging intelligent, evidence-based debate between all those with an interest in current and future climate trends.
10 reasons to be sceptical:
1) I'm always sceptical (and paranoid)
2) Just because I'm paranoid doesn't mean people aren't out to get me.
3) I am always sceptical of stuff I don't understand and never actually studied.
4) People who are paid big money by industry told me I should be sceptical.
5) Media sources owned by Rupert Murdoch told me I should be sceptical.
6) I'm a generally negative and pessimistic person.
7) If I weren't sceptical, reality might interfere with my tightly held irrational beliefs.
8) I have to be sceptical of anything put forward by people more educated than I as otherwise my inferiority complex would cause me issues.
9) I can't actually count all the way to 10.
- Status
- Not open for further replies.
Similar threads
- Replies
- 0
- Views
- 463
- Locked
- Replies
- 124
- Views
- 6K
- Replies
- 0
- Views
- 2K