http://www.vancouverobserver.com/bl...2-what-percentage-canadas-gdp-comes-tar-sands
Tar Secret #2: What percentage of Canada's GDP comes from the tar sands?
Barry Saxifrage Sep 26th, 2013
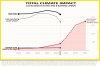
The "Tar Secrets" series delivers you essential climate facts missing from government and tar sands marketing spin. Last week we compared tar sands climate impact to US coal. This week we hunt down one of the most elusive facts of all: what percentage of GDP comes from tar sands. Any guesses?
In a nutshell
What the tar sands industry says -- Rapid expansion of bitumen extraction from the tar sands should be a "nation-building" priority. The many thorny climate, environmental, social-license and First Nations issues should not be allowed to significantly impede the industry because rapid expansion offers hundreds of billions of dollars to Canada's GDP over the next 25 years.
What they leave out -- How do the tar sands compare to other industries? Missing from the discussion is this needed piece of information: the percent of GDP that comes from the tar sands.
In years of researching the tar sands I've only seen this basic data point published once. Seven years ago the Canadian Energy Research Institute (CERI) estimated that the tar sands and related activities were around 1.5% of GDP in 2000. Since then...radio silence.
If the Canadian public can't compare the economic impact of different industries how can they possibly make informed decisions on which -- if any -- deserve priority status, "nation-building" trump cards and special exemptions?
In an effort to provide you with this essential "tar secret" I dug into several data sources and made my best effort at calculating it. (Note: for details on data sources and calculations see the "geeky details" section at the bottom of this article).
My calculations show the tar sands provide roughly 2% of Canada's GDP today. For every province outside Alberta the impact is less than one half of one percent of their GDP.
What about the future?
CERI estimates that if the tar sands industry is allowed to triple carbon extraction it could provide up to $2,106 billion in GDP over the next 25 years. But, again they don't tell you how that compares to the other parts of our huge economy. My calculations show that this would represent ~3.7% of Canada's $57 trillion dollars of GDP over that time. The province that would see the largest percentage impact outside Alberta would be BC at ~0.4% of our provincial GDP.
At a glance
My two charts below let you quickly see the relative contributions of the tar sands to our national and provincial GDPs.
Highlights:
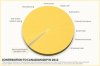
Statistics Canada data shows that "non-conventional oil extraction" provided 1.6% of Canada's GDP in 2012. Hey, did you guess the correct slice?
In addition, "support activities" for all mining, conventional oil and gas, and non-conventional oil extraction added another 0.7%.
So perhaps 2% of GDP is a good ballpark estimate from tar sands extraction and support activities
Over 90% of the economic benefit goes to Alberta. For provinces outside Alberta the tar sands contribute an average of 0.2% of GDP.
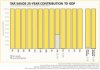
What about the future impact from a "nation building" effort to push past all the objections and roadblocks and thereby triple bitumen extraction? My next chart shows the percent of GDP resulting from the $2,106 billion that CERI's estimates could result from this over the next 25 years.
Highlights:
A tripling of tar sands could contribute ~3.7% of Canadian GDP over those 25 years.
According to CERI, around 94% of benefits would go to Alberta, producing perhaps a third of their province's GDP.
The remaining 6% of benefits would be spread out over the rest of Canada, producing less then one half of one percent of GDP for any other province.
CERI says "Ontario, British Columbia, and Quebec receive the highest impact" outside Alberta. BC would see the highest percent of GDP from tripling bitumen extraction: 0.4% of GDP.
Nation-building?
Here are some comparisons. In Norway the oil and gas sector produces 23% of GDP. In the UK the financial services sector produces 10% of GDP. In Canada, a sector like "Professional, scientific and technical services" produces 5% of GDP.
An effort that results in less than one half of one percent of GDP in all provinces outside Alberta just doesn't say "nation-building" to me.
There will be costs and benefits to Canadians from a rapid tripling of tar sands extraction. These need to be weighed against each other if we are to make informed decisions.
BENEFITS: As shown above, the economic benefits for every provincial economy outside Alberta would be a very tiny slice of GDP. Not to say that the impact is trivial, but it does not reach a level that I think justifies any special status, priority or exceptions. In every province but Alberta that is a long line up of other industries that contribute far more than the tar sands.
COSTS: I see many significant and troubling costs starting to emerge from a push to rapidly triple tar sands extraction:
A climate impact that could rival US coal
Abandonment our nation's climate targets
Scraping and weakening major environmental laws
Restricting of public-funded science
Restricting of public input on new projects
Ignoring the need for social licence in other provinces
Demonizing concerned Canadians as "radicals"
Bypassing First Nations' objections
Downplaying the risks of building bitumen pipelines across thousands of streams and running thousands of super-tankers through the wild coastal waters of BC
Are we going to go down this path and grant some of these extraordinary exceptions for an industry that provides 2% to 4% of national GDP and less than 1% to every provincial GDP but Alberta's? And if we do, aren't we opening Pandora's Box in which all the much bigger players in our huge economy can insist on their own list of exceptions?
Whatever Canadians decide, at a minimum they should be given the basic information -- such as percentage of GDP from the tar sands industry plans -- so they can make informed cost-benefit decisions.
Bonus graphic
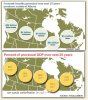
In the graphic below, both maps show the same thing -- how much a tripling of tar sands extraction might add to certain provincial GDPs over 25 years.
The top version comes from Canadian Association of Petroleum Producers (CAPP) website. It shows a 25 year total dollar amount.
The bottom version I created to show the same dollar amounts as a percentage of provincial GDP. In my version the tar sands contribution is shown as a bright red pie slice. For Quebec and Manitoba the contribution is not visible at the scale of the graphic.
The top version shows the potential dollars are not trivial. The bottom version shows that even a tripling of tar sands production is not expected to generate a significant share of GDP for any of these provinces.
Even CERI?
On a side note, one of the most interesting aspects to me of this particular "tar secret" is why CERI seems to have stopped publishing the tar sands' percentage of GDP.
Years ago they published an estimate of ~1.5% of GDP in 2000. They said that it might rise as high as 3% by 2020. Since then I've seen nothing from them on this.
For example, I just finished reading a 70 page tome from CERI: Economic Impacts of New Oil Sands Projects in Alberta (2010-*‐2035). It covered every financial aspect of tar sands you could imagine from "induced jobs in New Brunswick" to "Matrix with q‐m on the diagonal". They calculate dollars added to GDP for provinces and the nation. And yet nowhere do they report percent of GDP. I would expect it to be in the executive summary on page one and at least one simple pie chart.
Last month I read CERI's more recent 146-page tar sands economic geekout: Canadian Oil Sands Supply Costs And Development Projects (2012-2046). Once again there are pages and pages and pages of tables and charts about projected economic impact from different levels of tar sands extraction. Completely missing is the Econ-101 fundamental: percent of GDP.
Odd.
The geeky details
PERCENT OF GDP NOW -- I used two Statistics Canada (StatCan) tables. Table 379-0031 Gross domestic product (GDP) at basic prices, by North American Industry Classification System (NAICS) and Table 380-0064 Real gross domestic product, expenditure-based.
StatCan industry category "non-conventional oil extraction" is defined as: "This Canadian industry comprises establishments primarily engaged in producing crude oil from surface shales or tar sands or from reservoirs in which the hydrocarbons are semisolids and conventional production methods are not possible."
SIZE OF CANADIAN GDP OVER NEXT 25 YEARS -- I used StatCan Table 380-0064 Gross domestic product, expenditure-based for the years 1990 to 2012. From this I calculated the average annual GDP growth rate of 2.35%. I applied this growth rate to current GDP for 25 years. A sum of these years yielded $54.3 trillion.
SIZE OF PROVINCIAL GDP OVER NEXT 25 YEARS -- I used current GDP values from StatCan Table 384-0038 Gross domestic product, expenditure-based, provincial and territorial. I then applied the national average annual GDP growth rate of 2.35% (discussed above) to estimate 25 year GDP for each province.
TAR SAND 25-YEAR GDP -- I used CERI's Economic Impacts of New Oil Sands Projects in Alberta (2010-*‐2035) for 25-year GDP contribution from their reference scenario of tripling carbon extraction rates. These are the figures sited by CAPP and the Alberta government. CERI lists estimated tar sands GDP contribution in this scenario for all of Canada and per province. CERI lists values in "2010 dollars" while StatCan tables use "2007 dollars". I used StatCan official multiplier of 1.043 to adjust 2007 dollar figures to 2010 dollar equivalents.