OldBlackDog
Well-Known Member
Nature has a way of telling OBD he is full of nonsense. Typical isn't it.
OBD why don't you tell the members here why this is happening?
[FDRnH48LvhQ]https://www.youtube.com/watch?v=FDRnH48LvhQ
Here you go. Note the date please.
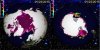
State of the Sea Ice – January 2015
Guest essay by Robert A Cook, PE
state-of-sea-ice-jan2015
Sea ice concentration, north and south poles as observed by satellite. Image from University of Illinois Cryosphere Today
Annually, the President is required to address the nation and report on the State of the Union. Other writers here regularly report on the oceans and El Nino/ENSO conditions, the duration and status of the extended “pause” in global warming we now are enjoying, and the global average satellite temperature anomalies. Thus, let us plan on summarizing, multiplying, dividing, and discussing the status of the world’s remaining sea ice on or about the twenty-second day of each month.
In particular, for the twenty-second of each month, we will calculate and present for discussion:
that day’s solar radiation level at top of atmosphere (TOA),
that day’s declination angle (the tilt of the earth’s axis towards or away from the solar plane),
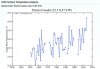
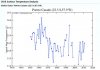
that day’s average Antarctic and Arctic sea ice area and extents,
an estimate of the latitude of the edge of that day’s Antarctic and Arctic areas,
at the edge of the sea ice for that day, estimate the total reflected and absorbed solar radiation into open water and sea ice for a clear day. (This requires an estimate of the sea ice albedo for that day, the solar elevation of the sun for each hour of that day, an estimate of the open ocean water albedo each hour at each solar elevation angle, and an estimate of the atmosphere’s clarity that day, and the air mass attenuating the sun’s energy each hour of that day at that latitude. )
an estimate of the average additional heat losses each hour on that day from the open ocean and from the sea ice.
Why regularly discuss sea ice area?
Well, with the “pause” now extending 18 years – 3 months, and with every other CAGW prediction regularly failing as CO2 steadily increases, Arctic sea ice loss is just about the only defense left of the CAGW’s basic predictions. It is regularly hyped and used, so you need to know the details of why they think it is important, and the limits to that assumed importance. (Certainly, the CAGW proponents will not tell you of any limitations or constraints Arctic sea ice poses to their theory of Arctic amplification!) Antarctic sea ice, on the other hand, is failing every assumed CAGW result, and is just uniformly ignored. On the other hand, because it disproves the basic CAGW predictions, you need to know the details of Antarctic sea ice, the problems it poses, and the threats it poses.
Why the twenty-second of each month?
It is a convenient and exciting (well, interesting at least) day for almost all of the changes in all areas we need to look at through the year: solar radiation levels, the earth’s declination, the Antarctic and Arctic sea ice minimums and maximum areas. The summer and winter solstices (longest day and longest night of the year occur on or about the 22 Dec and 22 June each, the fall and spring equinox fall 90 days later on 21-22 March and 21-22 September each year. The Antarctic sea ice maximum occurs during the two weeks after 22 Sept each year, the Arctic sea ice minimum occurs a few days earlier: now it is averaging 15-20 Sept. The Antarctic sea ice minimum occurs around 22 Feb each year, the Arctic sea ice maximum occurs a the weeks after 22 March. Solar radiation is not quite as convenient scheduled, but it is at least completely predictable: maximum solar TOA occurs halfway between 22 Dec and Jan 22 each year, solar TOA minimum occurs 5 July, halfway between 22 June and 22 July.
Antarctica first?
I will usually mention Antarctic sea ice first for several reasons.
First, it is almost always ignored by the CAGW press agents because the Antarctic sea ice reflects badly on several of their predictions about the effects of CO2 in particular and global warming in general. As observers of the global warming debate, you need to know what is happening all over, not just what the press agents want you to know, and what they don’t want you to know.
As important as that is, you will find through the next few months just how much more important the Antarctic sea ice area actually is to the world’s heat balance: The much-hyped Arctic amplification is a very real effect. But it does NOT only occur in the limited area of the Arctic (where sea ice has been receding for several decades) but around the unlimited seas and ever-increasing sea ice surrounding the Antarctica. Down south, where the sun is always higher in the sky and the solar energy reflected back into space much greater, sea ice area really does matter. Up north? Not so much almost all of the year.
Equations.
I will not go into a lot of the equations involved in this first report – there is time for that a bit later. They need to be covered, and the constants and variables need to be looked at in detail. Few “facts” you think you know, very few of the “Wikipedia” constants and textbook assumptions about sea ice really are constant, and almost none of the facts about sea ice, albedos, and solar radiation levels that “everybody knows” are, in fact, actually facts that can stand up to close examinations.
Models and constants and equations?
Challenge any item or equation you disagree with or wish to expand upon. I will in general treat any specific equation sourced from common geometry (such as a conversion of area into latitude, or the solar elevation angle calculated for a day-of-year and hour-of-day and latitude as a specific ‘thing”. It is not a model, nor an approximation. At sea level, the sun really is exactly that high in the sky on that hour of that day of the year at that latitude on earth. If you disagree with an equation, cite your source and justify the difference.
Measured data from field research is a bit different. In general, I will not use error bars or approximations nor will I use purely theoretical data or laboratory approximations such as the Fresnel equations for the albedo of water. (Pure water, in a lab, measured in still air from still water with perfectly aligned parallel and perpendicular light waves? Those conditions do not occur around Cape Horn.)
Everywhere possible, I will quote the experimental data for actual measurements taken in the Antarctic and Arctic itself (sea ice albedo, air temperatures, water temperatures, winds and wind direction, sea ice area, cloudiness and direct/indirect radiation levels); or from the measurements of real seas and real winds and real waves in the open ocean (ocean albedo). I will often approximate experimental results (particularly x,y graphs from old pdf files and graphs) with equations and curve-fit lines. Expect this, and offer better approximations as you see fit and as you can. But the original experiment results ARE the data! You can argue with my approximations (models ?) of each experiment, but you cannot disagree with the real world. Equally, each real world experiment has its own limits and its own assumptions. Again, each source will be discussed in detail over time. Each experimental source will be cited as each detailed equation is discussed – and there will be disagreements between measured results from different sources writing in different journals at different times. Where the source article does present a specific equation or approximation of his or her own work, that equation or constant will usually be used “as-written” for that time frame or those conditions. (For example, in 2001, Dr Judith Curry measured Arctic sea ice albedo as 0.823 That value will be used for all sea ice between January and early May. Her data showed a significant decrease in Arctic sea ice albedo between May and early September, and so her reported values will be curve-fit, and used for all Arctic sea ice albedos between those dates. She has no recorded values for albedo between September and January, so the 0.823 value will be assumed valid after September.)
Solar radiation will usually be addressed pretty much as the measured source data was obtained: in terms of direct radiation only under clear skies with typical Arctic conditions at typical arctic latitudes. Diffuse radiation and cloud cover and relative humidity levels are very important, but we need to get through many other things first. Land area and sea ice area will generally use millions of square kilometers as units (abbreviated as Mkm^2) . Angles are usually in degrees.
Your additions and questions about any value are encouraged of course, but –as Willis requires, always cite exactly what item or quote you question and why you feel it needs to be corrected.
I will not take credit for the basic research results discussed here – all of the hardest field work has already been done years before by many people and many teams from many nations and many institutions, nor of the basic equations and fundamentals used each time. Others deserve that credit, and they will be credited as each detail is discussed. I do acknowledge integrating their work together, and am responsible for the results discussed each time in this series.
Enough talk – You are (probably) even less interested than I in philosophical minutia of the differences between models and equations, between predictions and presumptions and projections and forecasts.