
on the posted escapement numbers: I can't tell if you know better and only want to present data that doesn't as clearly suggest farm impacts; or you know better and are consciously omitting data. So here goes the explanation:
"Escapement" numbers are the numbers of fish that "escape" all the various capture fisheries and arrive to be enumerated on the spawning grounds. There are assumptions made in generating these data and assumptions made in inputting these data into one of those dreaded models that you are so afraid of, yet can never deliver clear science-based critiques. Not every watershed is enumerated, and not all of the sections within any watershed are enumerated. Most of the escapement data are derived from streamwalks. There are still a few operating and funded fish fences, but not many. Sometimes overflights and/or float surveys are done. Most often only a few watersheds out of many are dependably funded for annual streamwalks.
When the streamwalks are done, a formula is used to "bump-up" the numbers that are observed. Then, these data are utilized in one of those models that you claim you dislike, CK. In this case it is called "area under the curve". IF you get enough streamwalks within the same season, that output from the model is reasonably accurate. Often only 1-3 walks are performed and that number is a really big guess. For some species/watersheds - water clarity, height, weather and other variables preclude an accurate count.
In order to understand productivity - and more importantly - ocean survival rates - you must also add on total capture from the various fisheries along the way to estimate total run returns. That is often even more difficult to get the numbers, and often the ones you get from some fisheries - are a guess as well.
So, the estimate of total run size and ocean survival rates is really difficult - and that's the metric to look at population-level impacts from things that are in the ocean - like fish farms - NOT escapement data. Let me give you an example:
If the hatcheries on the WCVI put out 100,000 smolts and 10,000 adult Chinook come back - that's a 10% ocean survival rate. 90,000 died somewhere along the trip.
IF (on the other hand) those same hatcheries pump out a MILLION smolts and 10,000 Chinook come back - that's a 1% ocean survival rate. It shows up as the same escapement number, but in this case - over 990,000 fish died along the way for this age group.
see the difference?
for the same escapement number we have a difference of 900,000 fish dead (i.e. 990,000-90,000) and no way to recognize this using only escapement numbers.
Another compounding factor - Chinook can come back to spawn at any age from age 3 through age 6. So, what happened in one brood year can be hidden within the brood year returns of another spawning event. You need to separate-out brood years, commonly done using scale/age data.
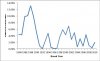
see the graph below for WCVI Chinook Marine Survival Trend for Age 2 – RCH Indicator Stock. Ocean survival rates of +3% are fair to good, 14% is spectacular, 0% very bad (duh!). So the years pre-1988 were good (I think those are the years - but it's hard to read the legend on the bottom accurately), but something bad happened for the brood year of 1992 (post-emergence time of 1993 for Ocean-type Chinook), as well as 95/96, 2004, 2006 and 2009 (or thereabouts - the numbers and check marks don't seem to line-up). Looking back at the escapement graph - you can't determine this - which is why CK's "whistle a happy tune" "we are not having an effect, see?" expectations are ill-founded by presenting escapement data alone. The trend since 1988 is downwards also - a little worrying.
Another worry - ocean productivity for other Chinook stocks (broad-scale, coast-wise) had a really good peak in 2001-2006 - not echoed here, during the same time frame. That's the timeframe I would be looking for differences in early life history and seeing about correlations to potential smaller-scale impacts (i.e. sea lice outbreaks, etc) that are likely to be of a more localized effect. That effect is magnified in 2004/06. Those are the years I would key in on and since the graph is brood year - it would be 2005/7 when the smolts hit the water (for ocean-type Chinook, which I think WCVI stocks are).
..."On {Juvenile} Chinook salmon, prevalence varied between 1% in 2006 to 15% in 2005 found in "The Clayoquot Sound Sea Lice Working Group. 2009. Prevalence and density of sea louse (L. salmonis and C. Clemensi) infections in juvenile chum salmon (Oncorhychus keta) in Clayoquot Sound, 2004-2007 - something YOU posted CK! Sea lice prevalence of 15% is about 3-5 times the normal background levels of stocks not associated with fish farms in the Pacific: http://uuathluk.ca/Microsoft Word - CSSWG sea lice report.doc.pdf
See how it's done, CK?
AND for the record - 1/ yes there are other impacts than those from fish farms, and 2/ I am satisfied that not all locations/years of fish farm operations are bad for all smolts of all species at all times. I think it is likely that for some high productivity years - the potential negative effects of fish farm operations are overwhelmed by good productivity. It's the poor productivity years that extra impacts have an "extra" effect. Those are the ones where it really matters. If you have a population barely surviving at a low 2% ocean survival rate - and fish farms (or any other localized impact) removes another very low amount or 1% - NOW that stock is in decline.
"Escapement" numbers are the numbers of fish that "escape" all the various capture fisheries and arrive to be enumerated on the spawning grounds. There are assumptions made in generating these data and assumptions made in inputting these data into one of those dreaded models that you are so afraid of, yet can never deliver clear science-based critiques. Not every watershed is enumerated, and not all of the sections within any watershed are enumerated. Most of the escapement data are derived from streamwalks. There are still a few operating and funded fish fences, but not many. Sometimes overflights and/or float surveys are done. Most often only a few watersheds out of many are dependably funded for annual streamwalks.
When the streamwalks are done, a formula is used to "bump-up" the numbers that are observed. Then, these data are utilized in one of those models that you claim you dislike, CK. In this case it is called "area under the curve". IF you get enough streamwalks within the same season, that output from the model is reasonably accurate. Often only 1-3 walks are performed and that number is a really big guess. For some species/watersheds - water clarity, height, weather and other variables preclude an accurate count.
In order to understand productivity - and more importantly - ocean survival rates - you must also add on total capture from the various fisheries along the way to estimate total run returns. That is often even more difficult to get the numbers, and often the ones you get from some fisheries - are a guess as well.
So, the estimate of total run size and ocean survival rates is really difficult - and that's the metric to look at population-level impacts from things that are in the ocean - like fish farms - NOT escapement data. Let me give you an example:
If the hatcheries on the WCVI put out 100,000 smolts and 10,000 adult Chinook come back - that's a 10% ocean survival rate. 90,000 died somewhere along the trip.
IF (on the other hand) those same hatcheries pump out a MILLION smolts and 10,000 Chinook come back - that's a 1% ocean survival rate. It shows up as the same escapement number, but in this case - over 990,000 fish died along the way for this age group.
see the difference?
for the same escapement number we have a difference of 900,000 fish dead (i.e. 990,000-90,000) and no way to recognize this using only escapement numbers.
Another compounding factor - Chinook can come back to spawn at any age from age 3 through age 6. So, what happened in one brood year can be hidden within the brood year returns of another spawning event. You need to separate-out brood years, commonly done using scale/age data.
see the graph below for WCVI Chinook Marine Survival Trend for Age 2 – RCH Indicator Stock. Ocean survival rates of +3% are fair to good, 14% is spectacular, 0% very bad (duh!). So the years pre-1988 were good (I think those are the years - but it's hard to read the legend on the bottom accurately), but something bad happened for the brood year of 1992 (post-emergence time of 1993 for Ocean-type Chinook), as well as 95/96, 2004, 2006 and 2009 (or thereabouts - the numbers and check marks don't seem to line-up). Looking back at the escapement graph - you can't determine this - which is why CK's "whistle a happy tune" "we are not having an effect, see?" expectations are ill-founded by presenting escapement data alone. The trend since 1988 is downwards also - a little worrying.
Another worry - ocean productivity for other Chinook stocks (broad-scale, coast-wise) had a really good peak in 2001-2006 - not echoed here, during the same time frame. That's the timeframe I would be looking for differences in early life history and seeing about correlations to potential smaller-scale impacts (i.e. sea lice outbreaks, etc) that are likely to be of a more localized effect. That effect is magnified in 2004/06. Those are the years I would key in on and since the graph is brood year - it would be 2005/7 when the smolts hit the water (for ocean-type Chinook, which I think WCVI stocks are).
..."On {Juvenile} Chinook salmon, prevalence varied between 1% in 2006 to 15% in 2005 found in "The Clayoquot Sound Sea Lice Working Group. 2009. Prevalence and density of sea louse (L. salmonis and C. Clemensi) infections in juvenile chum salmon (Oncorhychus keta) in Clayoquot Sound, 2004-2007 - something YOU posted CK! Sea lice prevalence of 15% is about 3-5 times the normal background levels of stocks not associated with fish farms in the Pacific: http://uuathluk.ca/Microsoft Word - CSSWG sea lice report.doc.pdf
See how it's done, CK?
AND for the record - 1/ yes there are other impacts than those from fish farms, and 2/ I am satisfied that not all locations/years of fish farm operations are bad for all smolts of all species at all times. I think it is likely that for some high productivity years - the potential negative effects of fish farm operations are overwhelmed by good productivity. It's the poor productivity years that extra impacts have an "extra" effect. Those are the ones where it really matters. If you have a population barely surviving at a low 2% ocean survival rate - and fish farms (or any other localized impact) removes another very low amount or 1% - NOW that stock is in decline.
Attachments
Last edited by a moderator: