searun
Well-Known Member
The IPHC released the 2024/25 stock assessment on Dec 19th. Here's the link: https://www.iphc.int/uploads/2024/12/IPHC-2025-SA-01.pdf
My quick read is the management actions in last few seasons where we took some fairly aggressive reductions in fishery intensity are slowly paying off, against a back drop of 2 recruitment age class groups that are starting to dominate our fisheries (2012 & 2016). There is a very slight up tick in spawning biomass.
IMO it seems that it is likely this upcoming IPHC will probably land on status quo at best, or possibly another reduction in the overall fishable TAC to ensure the increasing biomass trend continues. Can also see the IPHC taking a wait and see how these 2 dominant age class groups perform in the fishery and if there are other good recruitment years coming up behind those to ensure there is sufficient recovery in abundance. If you look at the historic trend we are still at very low productivity and spawning abundance levels. Still concerning is we continue to teeter just above the 30% trigger point (currently only 8% above) where there would be reductions in fishing intensity to avoid declines down to the 20% level where all fisheries are closed.
Some highlights:
The IPHC’s interim management procedure uses a relative spawning biomass of 30% as a fishery trigger, reducing the reference fishing intensity if relative spawning biomass decreases further toward a limit reference point at 20%, where directed fishing is halted due to the critically low biomass condition.
The relative spawning biomass at the beginning of 2024 was estimated to be 38%**(credible interval: 18-55%), slightly higher than the estimate for 2023 (37%).
** Note - 8% above fishery trigger to reduce fishing intensity.
Fishing mortality from all sources in 2024 was estimated to be down 5% from 2023.
Note: resulting decrease in catches/removals related to management measures to reduce fishing intensity
The 2024 modelled Fishery-Independent Set line Survey (FISS; see IPHC2025-AM101-09 and ) detailed a coast wide aggregate Numbers-Per-Unit-Effort (NPUE) which increased by 3% from 2023 to 2024
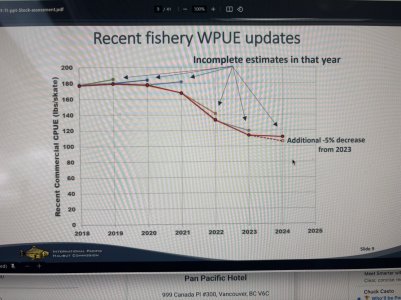
The modelled coast wide FISS Weight-Per-Unit-Effort (WPUE) of legal (O32) Pacific halibut, the most comparable metric to observed commercial fishery catch rates, decreased by 9% from 2023 to 2024.
Note: this indicates smaller younger age class fish starting to dominate fishery, and older larger fish are aging out of fishery
Biological information (ages and lengths) from both the commercial fishery and FISS shows the continuing shift from the previously dominant 2005 year-class to the 2012 cohort (12years old in 2024) and now the 2016 cohort (8 years old in 2024).
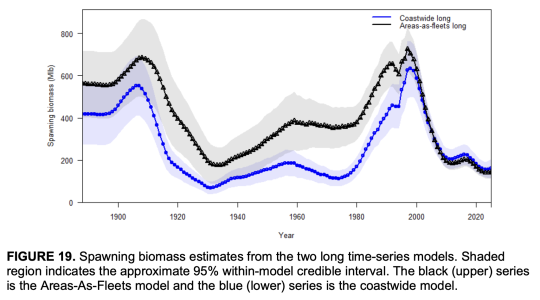
The results of the 2024 stock assessment indicate that the Pacific halibut stock declined continuously from the late 1990s to around 2012.
The spawning biomass (SB) is estimated to have increased gradually to 2016, and then decreased to a low of 145 million pounds (~65,700 t) at the beginning of 2024. At the beginning of 2025, the spawning biomass is estimated to be 149 million pounds(67,500 t) with an approximate 95% credible interval ranging from 97 to 216 million pounds(~44,100-98,200 t).
NOTE - older larger age classes are aging out of fishery being replaced by smaller sized 2012 and now 2016 more abundant age class recruits into the fishery - good news is slowly seeing very small increases in spawning biomass resulting from lower fishing intensity
Based on age data through 2024, this assessment estimates that the 2012 and 2016 year-classes are currently the most important in the fishery and survey catches but are only near average when compared to the preceding 15 years.
Note: basically average recruitments, so not going to result in a significant increase in spawning abundance longer term without more substantial new recruit age class groups coming up behind these 2 age class groups
Biological information (ages and lengths) from the commercial fishery landings showed that in 2024 the 2012 year-class (now 12 years old) was again the largest coast wide contributor (in number) to the fish landed. This follows the same patterns observed in 2022-23, after the fishery transitioned from the previously most-abundant 2005 year-class. The FISS also observed the 2012 year-class as a large proportion of the total catch, but the largest proportion comprised the 2016 year-class (age-8 in 2024) also observed in the commercial fishery and recent recreational fisheries.


