Climate: LNG in B.C. vs Alberta tarsands

Status
Not open for further replies.
As noted to you before.
No discussion? No admitting of any valid logic?

Guess I can't expect that. Thanks for keeping it civil at least OBD.

to be honest -I guess I post here not because I believe I can change your mind OBD. That is pretty firmly made-up regardless of any objective and valid points I make.

No - I post because maybe someone else reading this can see where the logical and rational arguments are - are where the emotional fear-based propaganda lies. Where the lies lie.

For myself - I REFUSE to give-up my rational thinking skills. I REFUSE to be intimidated or lied to. That is why I enjoy Science. It is a truth-seeking vocation. Only those unfamiliar with Science don't understand this.

Lets - for just a moment - decide that global warming is a hoax.

What's the worst that could happen if we cut back on our hydrocarbon consumption?

Hmmmm......

We extend our limited hydrocarbon supply maybe a generation or two longer than we will when we run out of it - and make no mistake - we will run out of hydrocarbons in some generation near you.

That's sounds ok, right?

We decrease the amount of mercury and other contaminants in our air, soil, and water.

Wow! That can't be a bad thing either, right?

We create - "jobs, jobs, jobs"!!!

Gee - That doesn't sound like a bad thing, either.

Ok - so what do you have against leaving the world a better place when you leave it, OBD? What's your legacy? How is cutting back on hydrocarbon consumption and increasing our reliance on renewable resources a BAD thing? Why are you arguing against doing this? Are you that truly scared of change Are you that truly scared of change that you ignore the logic above??
 
Last edited by a moderator:
GLG's, new leader for Canada.
Tax the people and let's get those pipelines going.

Trudeau vows to adopt carbon pricing if Liberals win election

Liberal Leader Justin Trudeau has vowed to adopt carbon pricing to combat climate change if he becomes prime minister, proposing a medicare-style model that would see Ottawa set national targets and enforce principles but allow provinces to manage their own systems.

The Liberal Leader launched his climate policy – which will be a major plank in his election platform – during a speech Friday at Calgary’s Petroleum Club, whose oil industry members are struggling to cope with the steep drop in global crude prices over the past eight months.

He slammed Stephen Harper for failing to lead on climate policy, saying the Prime Minister has given Canada a black eye internationally, which has hurt the industry’s efforts to build much-needed crude pipelines. And he said the New Democratic Party wants to impose a “one-size-fits-all solution from Ottawa,” with its proposed cap-and-trade approach.

Mr. Trudeau is attempting to walk a fine line: on the one hand, supporting pipelines and the growth of the oil sands industry, while insisting the country needs federal leadership in combatting climate change. He is also leaving the key details of any national system – actual price per tonne of greenhouse emissions, whether a tax or cap-and-trade – to a first ministers’ conference which would not occur until after the election scheduled for October.

But he made it clear that his plan includes a price on carbon, and that all provinces would be expected to carry their share of the burden.

“Many in this room believe that a price on carbon is good for the environment, for the economy, and for Alberta’s oil and gas sector,” he said in a speech to the business audience, noting many companies already operate with an assumed carbon price.

“You know Canada needs to have a price on carbon. The good news is that we’re already on our way.”

He cited policies in British Columbia, Alberta and Quebec, and noted that Ontario will soon be introducing some form of price on carbon, either through a tax or a cap-and-trade system similar to Quebec’s. Mr. Trudeau said the country needs federal leadership, but not Ottawa acting alone.

“The problem is the provincial approaches are unco-ordinated, and limited by a lack of federal leadership,” he said.

He said he would travel to the United Nations’ climate summit in Paris in December, where countries hope to conclude a treaty on emission, and send the message that “Canada takes its environmental responsibilities seriously, and we will do more in the fight against climate change.”
 
Ignore the questions that appear to be tough, eh OBD?

Just keep posting...keep cutting...keep pasting...just stay away evil thoughts...

You know I think I figured-out why Al Gore - "gores" the denier camp so badly.

I have seen quite a few posts from OBD where Gore is the recipient of much vitriol.

I believe that is because the denier camp thinks this is a popularity contest.

To be honest - I really don't even see Gore as a player in all of this. Never once have I posted one of Gore's lectures or videos. The reason?

No need to. he is "not a scientist", as far as I know

Instead I usually post from the Sciences - from many hundreds of peer-reviewed reports by many thousands of credible, published authors - with support teams numbering in the hundreds of thousands - by dozens of agencies, universities, and countries.

Science is not a popularity contest OBD. That's the thing the denier camp doesn't understand because - on their side - it is.

People are allowed to get away with the utmost outrageous and stupid remarks (like God predetermines the air in footballs, or Barbara Streisand is the cause of Global Warming - or global warming is a hoax perpetrated by geeks in lab coats to ruin the economy - for that matter) - because they are popular.

Why are they popular?

Someone with deep pockets have promoted them.

Some are even someone's elected representatives - where big oil and coal has funded their campaigns.

IMHO - many are truly nasty people who get paid big $ to lie.

I reject their nastiness and vision for the future. I reject their lies.

That is why I read the science - and don't need any TV personalities - thank you very much.

It's really not that scary using your critical thinking skills, OBD. It's actually quite liberating. So is opening up your heart, with intelligent people.
 
Last edited by a moderator:
http://switchboard.nrdc.org/blogs/n...e=fb&utm_medium=post&utm_campaign=socialmedia

Nick Magrisso’s Blog

Illinois Clean Jobs Coalition: Labor, Faith, Health, Consumer, Business and Green Agreement
Nick Magrisso
Posted February 6, 2015

harmon.jpg

This week two seemingly unconnected announcements were made that will likely cast a big shadow over the state of Illinois for some time. Wednesday, Governor Bruce Rauner gave his first State of the State address. In the speech he outlined Illinois' grave economic position and repeatedly highlighted a desire to push new policies that will make the state more competitive and create jobs.

The same day, a new coalition was announced that could help make his wish come true: the Illinois Clean Jobs Coalition.

At events in Springfield and Chicago, this unprecedented coalition of business interests, organized labor, interfaith groups, consumer advocates, and environmental groups announced shared goals to embrace clean energy and new job creation under a united banner. NRDC is a proud member of the coalition--and we think that looking at the state's energy economy is the perfect place to start to realize Governor Rauner's goal of making Illinois competitive. The coalition believes that some key policy tweaks will open the job flood gates to the tune of 32,000 jobs annually!

And we are not alone.

In Chicago, Mayor Rahm Emanuel threw his support behind the coalition's goals to grow the state and city's economy by creating new jobs in the clean energy industry, saying it is a "win-win for our environment and economy."

In Springfield I joined a similar announcement in the State Capitol with legislative leaders of the Illinois General Assembly, along with business partners and environmental colleagues who had a very similar message.

State Senator Don Harmon (D-Oak Park) summed up what was said by a labor leader from the buildings trades unions who stood at the Chicago event, saying, "This coalition is about three things - jobs, jobs, jobs."

The immense job opportunities coming out of the clean energy sector are pretty easy to track. NRDC put out an employment audit last year with Clean Energy Trust, Environmental Entrepreneurs (E2), and the Environmental Law and Policy Center (ELPC) that showed the state currently has a massive clean energy work force, numbering over 100,000. That is more than the number of people employed in the state's real estate and accounting sectors--combined. That is a ton, but there is oh-so-much more to be had: a recent Report from the Illinois Science and Technology Institute puts the number at 32,000/year.

But unlocking those jobs requires some policy fixes. Until then, we are falling behind. Just look at wind power. Two years ago, Illinois ranked second in new wind installations. Last year, we did not add anything. And it was just announced that Illinois was overtaken by Oklahoma in total wind power after that lull.

There's a fix to this trend. The coalition is calling on the state to re-embrace renewables and energy efficiency as a jobs policy, as well as good environmental policy. If we realized the potential of robust energy efficiency and renewable energy standards, we could see the sort of growth predicted in the ISTI study.

The Illinois Clean Jobs Coalition proposing doing that in three ways:

First, by "fixing" the Renewable Portfolio Standards (or "RPS") to increase the share of power coming from renewable sources in Illinois, like wind and solar, to 35% by 2030.
Second, increase energy efficiency standards to reduce overall electricity usage in Illinois by an accumulative 20% by 2025. Simply put, energy efficiency is the cheapest, cleanest form of energy we have; it's the energy we don't use. By retrofitting our homes, businesses, schools and hospitals with the latest energy efficient technologies (better insulation, newer windows and lighting, better/smarter systems for our heating, ventilation and cooling systems) just to name a few examples, we can accomplish the same amount of work and use less energy. That saves money on energy bills, cutting pollution from power plants and putting lots of people to work making and installing energy efficient measures.
Third, it is time to pursue market-based strategies to reduce carbon pollution and shift toward cleaner energy; which will provide a healthier future for all Illinois families. The recently proposed Clean Power Plan offers the state of Illinois an opportunity to modernize our energy infrastructure and scale up Illinois' clean energy economy. The tools that would be used to realize the goals of that plan also spawn investments that not only power our state, but clean our skies and improve the health of our communities.
The coalition has made clear, that now is the time to act - simply to keep pace with other states.

A cleaner and healthier environment; help for consumers; improved public health - and, tens of thousands of new jobs for Illinois each and every year. Those are the goals of the Illinois Clean Jobs Coalition, and those goals are within reach. And we think they are very much in line with the ones Governor Rauner laid out this week too.
 
http://www.sciencedaily.com/releases/2015/02/150206071239.htm

Ancient snow patches melting at record speed
Date: February 6, 2015
Source: The Norwegian University of Science and Technology (NTNU)
Summary: Norway is dotted with small glaciers and permanent snow patches that contain all sorts of archaeological treasures, from ancient shoes to 5000-year-old arrowheads. But climate change has turned up the temperature on these snowfields and they are vanishing at an astonishing rate.

Norway is dotted with small glaciers and permanent snow patches that contain all sorts of archaeological treasures, from ancient shoes to 5000-year-old arrowheads. But climate change has turned up the temperature on these snowfields and they are vanishing at an astonishing rate.

They actually shouldn't be found in Norway. Summers are too hot and winters too dry for glaciers or perennial snow patches to form here. Yet, the Kringsollfonna ice patch in Sør-Trøndelag county and the Storbreen glacier just north of Snøhetta mountain have done just that for over 5000 years, even surviving the warm period in the Middle Ages.

Now they're melting fast. With one or two more hot summers, they will be history.

Working around the clock
Scientists from the Norwegian University of Science and Technology (NTNU) who study these snowfields are busy. The NTNU University Museum is leading this project, and archaeologists have already retrieved exciting discoveries from areas that emerge when ice and snow disappears -- such as arrowheads that are over 5,000 years old.

Researchers from the Department of Geography, however, are most concerned with the relationship between weather conditions and how snow patches accumulate and melt away. Since research began in 2012, they have visited the two snow patches around ten times each year.

"Norway has a long tradition of taking measurements of glaciers of varying size, but we know very little about the smallest glaciers and what the locals refer to as snow patches," says Associate Professor Geir Vatne of NTNU's Department of Geography.

Detailed data
A glacier is a perennial mass of moving snow and ice, while snow patches are stationary. Scientists use a lot of technological equipment to learn about glaciers and their characteristics.

Using a laser scanner and snow cores, researchers measure the accumulation of snow patches in the winter and their ablation- or melt- in summer. Traditional measurement methods such as stakes and snow soundings are more resource-intensive and provide poor data quality.

Ground-penetrating radar, or georadar, measures a glacier's thickness. The resulting high-resolution data are used to create 3D models that visualize changes in ice volume, which can then be matched with weather data. Scientists can also see if there are changes in winter precipitation and wind distribution of snow, or if there are changes in summer temperature that affect whether the snow patches shrink or grow.

Scientists use super-accurate GPS technology to measure whether there is movement in the snow patches. They also take sediment samples from snow patch melt water lakes to study how snow patches have varied in size and activity since the ice sheet retreated from the area. Researchers have also attempted to map the extent of snow patches in the landscape over time.

"Some of the results surprised us. It turns out that several of the snow patches are actually glaciers," says Vatne.
Distinguishing between snow patches and glaciers

But wait a minute. How can snow patches survive for 5,000 years when, based on the regional climate, they shouldn't even exist? Glaciers and snow patches, of which there are many in the Norwegian mountains, form where more snow accumulates in the winter than melts the following summer.

Northeast facing snow patches are typically recessed and sheltered from direct sunlight and the dominant winds for much of the year, so they collect windblown snow.

The Storbreen glacier is located high in the mountains in a permafrost area, which means that there is frost in the ground year round. Scientists have measured the temperature at the bottom of the glacier at minus 1.4 degrees in the summer, revealing that the glacier is frozen solid below and is not moving much.

"Even with barely measurable movement," Vatne says, "Storbreen is still called a glacier."

Gone forever

Researchers have not taken the temperature of the Kringsollfonna ice patch, but GPS measurements show that it is moving, making it more of a glacier than a snow patch. This knowledge can help archaeologists explain their findings.

Snow patches are nature's own freezers, storing pollen and animal bones, among other things. Now the lid of the freezer has been removed, and snow patches are melting.

Vatne explains that when the snow patches are gone, wooden arrow shafts and other organic materials in the snow will quickly decompose. "Then they're lost forever. The probability of discovering finds in snow patches is greater than in glaciers, because they're not moving. The ancient materials inside moving glaciers have melted out long ago," he says.

Role in the ecosystem
Both Kringsollfonna and Storbreen accumulated a lot of snow during the winter of 2012, despite the fact that it did not snow especially much. The reason for the gain was that windy periods around and after major snowfalls caused snow to accumulate in depressions.

At the end of the summer later that year, four feet of snow from the previous winter remained, before new snow came. However, during the hot summer of 2014 Kringsollfonna lost over 10 meters of snow and ice.

"This loss wasn't just the snow from the winter before -- it included eight meters of old ice that disappeared. Our measurements show that now the snow patch is eight meters at its thickest point. With one more hot summer, all of Kringsollfonna could be gone," says Vatne.

He points out that snow patches play a role in our ecosystem. Reindeer are drawn to the snow patches on hot summer days, partly to avoid insects.

We may soon learn what happens when the reindeer don't have these cool places to survive the heat. Vatne has no doubt that we will.

"It's highly likely that snow patches will soon melt away," he said. "Perhaps for good."

Story Source: The above story is based on materials provided by The Norwegian University of Science and Technology (NTNU). The original article was written by Grete Wolden. Note: Materials may be edited for content and length.
 
http://www.onearth.org/earthwire/tu...e=fb&utm_medium=post&utm_campaign=socialmedia

TUNA TIME BOMB
A new study says the mercury levels in tuna are high—and getting even higher.

BY BRIAN PALMER | @PALMERBRIAN | 3 days ago
Jonás Amadeo LucasPHOTO: JONÁS AMADEO LUCAS
Back in the early 1970s, the Smithsonian Institution loaned a bunch of preserved fish to a team of chemists at the University of California, Irvine. The animals had already been dead for 80 or so years, but that’s why George Miller and his colleagues needed them—to settle a debate about mercury. Some scientists worried that pollution from coal-fired power plants and gold mining was concentrating mercury in the oceans. Others argued that humans couldn’t possibly alter the chemistry of the unfathomably vast seas. Miller wanted to compare mercury levels in the Smithsonian’s tuna, caught between 1878 and 1909, to those of modern fish.

Miller reported good news: Although both the fin de siècle and 1970s fish were high in mercury, the levels had remained steady. The mercury in fish was mostly naturally occurring, according to Miller’s 1972 article in Science, and human activity was not to blame.

Marine biologists and hydrologists have long questioned Miller’s conclusions. But even if he were right, the oceans are not infinite. Eventually, humans would burn enough coal and mine enough gold to increase the seas’ mercury levels, and that extra mercury would find its way into the fish we eat. A study published yesterday in the journal Environmental Toxicology and Chemistry suggests that day has come. Mercury levels in fish are indeed rising, and it’s probably going to get worse.

Over the past 17 years, the researchers conclude, the concentration of mercury in yellowfin tuna has increased by approximately 3.8 percent annually. At the current rate of mercury emission, they could become a very dangerous thing to eat in a decade or two.

FROM MINE TO PLATE

When we dig a lump of coal out of the ground and burn it for energy, significant amounts of mercury are released into the atmosphere. Coal-fired power plants emit more than 500 tons of mercury per year worldwide, according to United Nations data.

There is, however, an even larger source of atmospheric mercury: artisanal gold mining. No, artisanal mining doesn’t involve small-batch gold, lovingly extracted from the ground by a skilled craftsman. It’s a crude form of mineral extraction, typically undertaken by poor miners in marginalized communities in Asia, Africa, and South America. Many of the 10 million artisanal miners worldwide are women and children, who mix mercury with a gold-containing compound to draw out the precious metal. They then burn the mixture, which isolates the gold and sends mercury vapor into the air. This process contributes 800 tons of mercury to the atmosphere annually (in addition to poisoning the miners).

Rain, snow, and dust bring the mercury vapor into the ocean, where bacteria consume the mercury and convert it into methylmercury. Plankton eat the bacteria, small fish eat the plankton, large fish eat the small fish…and the mercury accumulates in higher concentrations as it travels up the food chain. Eventually, it winds up in tuna, swordfish, and other of our seafood favorites.


CSI: OCEAN FLOOR

Mercury doesn’t just come down from the sky. Lots of naturally occurring mercury also comes up from the seabed, and there have been long-running arguments over how much the atmosphere’s contribution even matters. Recent research, including yesterday’s study, seems to have settled the debate: It really, really matters.

Like many elements, mercury comes in a variety of configurations. While we can’t yet pinpoint the exact source of a particular bit of mercury—is it from a coal-fired power plant, gold mining, or the ocean floor?— we can determine the path it has taken to arrive in the oceans. If it has passed through the atmosphere or diffused into the water from the seabed, the mercury’s isotopic signature will let us know.

A 2013 paper in the journal Nature used this strategy to prove that between 20 percent and 40 percent of the ocean's mercury comes from the surface. According to another paper published last year, the concentration of mercury in the ocean has tripled since the start of the Industrial Revolution.

ENTER THE YELLOWFIN

Mercury in the ocean is measured in nanograms per liter, but those tiny units are misleading. Methylmercury is a potent toxin. Even at low concentrations, it can damage a fetus’ neurological development. In adults, ingestion can affect speech, hearing, coordination, and the sensation of pain.

More importantly, each time methylmercury takes a step up the food chain, it becomes concentrated by a factor of 10. That’s why health authorities typically counsel against eating shark and other top predators. A fish guide authored by NRDC (which publishes Earthwire) advises against eating more than three servings of yellowfin per month. Although the Food and Drug Administration considers the average yellowfin safe to eat, some of the fish tested in the agency’s random samplings have contained mercury far in excess of the recommended limit.

“The FDA publishes data on mercury in tuna, but that’s it,” says aquatic ecologist Paul Drevnick, the lead author of yesterday’s study. “Without knowing the size of the fish, it’s impossible to compare fish across time periods.”

Drevnick and his colleagues at the University of Michigan are helping us follow the trend of this toxin. They took existing data on mercury levels in yellowfin tuna caught near Hawaii over time and matched the fish by size and age. What they found was that although mercury content was stable for many years, it has been steadily rising since at least 1998.

The research comes with the usual caveats. It’s just one study, and the sample size of around 14 fish in the most recent dataset is small (although the mercury increase was still statistically significant). We need stronger data, and governments can do more to help researchers.

SPARE A THOUGHT FOR THE FISH

Studying the health effects of mercury in humans is hard. You have to estimate their consumption, then look for small differences in a large sample over long periods of time. Studying the effects on tuna is much easier—all you have to do is deliberately feed them mercury and watch. (Sorry, tuna, our research ethics are strongly slanted toward human interests.) Drevnick has done this research, too, and he found significant effects on reproductive behavior.

“I had an undergrad who filmed pairs of fish in the lab,” he says. “He called it fish ****.”

Mercury contamination, however, makes for really boring ****. It suppresses testosterone production in males, so they’re not interested in mating. Females produce less estrogen, so they have nothing to fertilize. Mercury makes for some G-rated cinema, and reproduction in the contaminated lab fish is lower than in control groups. That’s especially bad news if those effects extend to wild tuna, whose numbers are already low.

NOW WHAT?

Governments worldwide are aware of the mercury problem. In 2013, 140 countries ratified the Minimata Convention on Mercury, which requires countries to install the best available emission-control technologies on new coal-fired power plants. Mining for mercury itself will soon be banned, and companies will have to sharply reduce or eliminate the toxin in their products. The treaty has also helped bring funding for new research and remediation work.

As with most conventions, however, the legacy of Minimata will depend in large part on the implementation, which brings me back to gold mining. The delegates couldn’t agree on a single solution to artisanal gold mining, because the situation varies by region, says Susan Egan Keane, deputy director of the health program at NRDC. Some countries have a few thousands miners, who can be shifted into other economic pursuits. Others, like Ghana, have hundreds of thousands miners, whose ancestors have been mining gold for millennia, according to Keane, and there aren’t many other opportunities for them to earn money. Each country committed to developing its own plan to deal with artisanal gold mining, but fixing the problem could take decades. In the meantime, mercury will continue to accumulate in tuna.

“If I were a pregnant woman or a young child, I would avoid tuna,” says Keane.

If Drevnick’s study is accurate, that suggestion might apply to the rest of us, too.
 

Attachments

  • mercury-cycle.jpg
    mercury-cycle.jpg
    54.7 KB · Views: 26
https://www.knowledge.ca/program/tipping-points

In this six-part series, BC-based journalist and adventurer Bernice Notenboom heads to areas of the planet where climate systems may be nearing a tipping point. Bernice joins leading environmental scientists in the field as they explore the elements destabilizing our climate systems, and sees how changes in a remote area can – and do – dramatically impact other continents thousands of miles away, including North America. While there are no simple solutions, the series attempts to answer the pressing question: what is our timeline to change?
 
Representations of Aeolian Dust in CMIP5 Climate Models

Paper Reviewed
Evan, A.T., Flamant, C., Fiedler, S. and Doherty, O. 2014. An analysis of aeolian dust in climate models. Geophysical Research Letters 41: 5996-6001.

In providing some background for their analysis of how well the most up-to-date CMIP5 climate models represent aeolian dust, Evan et al. (2014) write that "aeolian dust is a key aspect of the climate system," since "dust can modify the Earth's energy budget, provide long-range transport of nutrients, and influence land surface processes via erosion." However, they indicate that the representation of dust in state-of-the-art climate models has not been systematically evaluated," and they thus proceed to fill this important analytic void.

Focusing on observations related to dust emission and transport from northern Africa - which they say is the world's largest source of airborne dust, citing Washington et al. (2003) - the four researchers evaluated "African dust in 23 state-of-the-art global climate models used in the Fifth Assessment Report of the Intergovernmental Panel on Climate Change," and in doing so, they determined that "all models fail to reproduce basic aspects of dust emission and transport over the second half of the twentieth century," and that they also "systematically underestimate dust emission, transport, and optical depth," while "year-to-year changes in these properties bear little resemblance to observations."

In light of their several findings, Evan et al. come to the conclusion that "there is no reason to assume that the projections of dust emission and concentration for the 21st century have any validity." And they add that their results "also cast doubt on the representation of other features of coupled Earth systems that are affected by aeolian dust, including regional land and ocean surface temperatures (Evan et al., 2009), precipitation and cloud processes (Kaufman et al., 2005; Yoshioka et al., 2007), coupled equatorial processes (Evan et al., 2011), and terrestrial (Das et al., 2013) and oceanic biogeochemistry (Mahowald et al., 2010)."

Given this terrible indictment of the models, one wonders how in the world the IPCC and others have so long claimed such certainty with respect to the models' future projections of climate.

References
Das, H., Evan, A.T. and Lawrence, D. 2013. Contributions of long-distance dust transport to atmospheric P inputs in the Yucatan Peninsula. Global Biogeochemical Cycles 27: 167-175.

Evan, A.T., Foltz, G.R., Zhang, D. and Vimont, D.J. 2011. Influence of African dust on ocean-atmosphere variability in the tropical Atlantic. Nature Geoscience 4: 762-765.

Evan, A.T., Vimont, D.J., Bennartz, R., Kossin,J.P. and Heidinger, A.K. 2009. The role of aerosols in the evolution of tropical North Atlantic Ocean temperature. Science 324: 778-781.

Kaufman, Y.J., Koren, I., Remer, L.A., Rosenfeld, D. and Rudich, Y. 2005. The effect of smoke, dust, and pollution aerosol on shallow cloud development over the Atlantic Ocean. Proceedings of the National Academy of Sciences USA 102: 11,207-11,212.

Mahowald, N.M., Kloster, S., Engelstaedter, S., Moore, J.K., Mukhopadhyay, S., McConnell, J.R., Albani, S., Doney,S.C., Bhattacharya, A., Curan, M.A.J., Flanner, M.G., Hoffman, F.M., Lawrence, D.M., Lindsay, K., Mayewski, P.A., Neff, J., Rothenberg, D., Thomas, E., Thornton, P.E. and Zender, C.S. 2010. Observed 20th century desert dust variability: Impact on climate and biogeochemistry. Atmospheric Chemistry and Physics 10: 10,875-10,893.

Washington, R., Todd, M., Middleton,N.J. and Goudie, A.S. 2003. Dust-storm source areas determined by the total ozone monitoring spectrometer and surface observations. Annals of the Association of American Geographers 93: 297-313.

Yoshioka, M., Mahowald, N.M., Conley, A.J., Collins, W.D., Fillmore, D.W., Zender, C.S. and Coleman, D.B. 2007. Impact of desert dust radiative forcing on Sahel precipitation: Relative importance of dust compared to sea surface temperature variations, vegetation changes, and greenhouse gas warming. Journal of Climate 20: 1445-1467.

Posted 3 February 2015
 
http://insideclimatenews.org/news/0...pose-threat-pipelines-under-rivers-nationwide

Yellowstone Oil Spills Expose Threat to Pipelines Under Rivers Nationwide
At the time the Poplar pipeline ruptured, about 110 feet of it was completely uncovered along the bottom of the Yellowstone River, exposing it to damage.
By Elizabeth Douglass, InsideClimate News Feb 6, 2015

Oil spill response workers clean up oil on the Yellowstone River on Jan. 25, 2015, near the site of Bridger Pipeline's pipeline rupture. When Bridger last checked its pipeline 3.5 years ago, it was buried eight feet under the riverbed. When it burst, it was found to be sitting there exposed, vulnerable to damage by debris and other objects and corrosion. Credit: U.S. EPA


Bridger Pipeline LLC was so sure its Poplar oil line was safely buried below the Yellowstone River that it planned to wait five years to recheck it. But last month, 3.5 years later, the Poplar wasn't eight feet under the river anymore. It was substantially exposed on the river bottom—and leaking more than 30,000 gallons of oil upstream from Glendive, Montana.

An ExxonMobil pipeline wasn't buried deeply enough for the Yellowstone River, either. High floodwaters in 2011 uncovered the Silvertip pipe, leaving it defenseless against the fast-moving current and traveling debris. It broke apart in July, and sent 63,000 gallons of oil into the river near Laurel, Montana.

Both companies underestimated the river's power and its penchant for scouring away the earth that's covering and protecting their pipelines. That miscalculation led to the Exxon Silvertip spill and it's likely to be declared a significant factor, at a minimum, in the Poplar spill.

Such misjudgments have potentially troubling implications nationwide, since pipelines carrying crude oil and petroleum products pass beneath rivers and other bodies of water in more than 18,000 places across America. Many of them are buried only a few feet below the water.

"There were a lot of people who wanted to think that the last pipeline spill in the Yellowstone River in 2011 was a freak accident that would never happen again. After this most recent spill, no one believes that anymore," said Scott Bosse, Northern Rockies director for American Rivers. "The truth is, there are probably hundreds of pipelines across the country that are at considerable risk of rupturing under our rivers."

While corrosion is the No. 1 cause of pipeline spills, a sizable number of pipelines at water crossings have ruptured or been endangered by river scour. Among them:

► The Poplar (Jan. 2015) and Silvertip (July 2011) pipeline failures on the Yellowstone River.

► More than 20 pipeline river crossings in Montana were found to be "dangerously close to exposure" during inspections of nearly 90 pipeline crossings in 2011, according to one report. Many of them have since been reburied significantly deeper. The Poplar pipeline was not among the crossings tagged as being close to exposure.

► Nearly half of the 55 oil and gas pipelines that cross the Missouri River were found to have sections buried 10 feet or less below the riverbed, according to the Wall Street Journal. A study by the U.S. Geological Survey, meanwhile, found that the Missouri riverbed had deepened by nine to 41 feet in 27 places because of severe scouring during the 2011 floods.

► An Enterprise Products Partners LLP pipeline that was uncovered by river scouring and ruptured in August 2011. The line spilled more than 28,350 gallons of a gasoline additive into the Missouri River in Iowa.

► A June 2012 spill in Alberta, Canada, where an oil pipeline owned by Plains Midstream Canada failed along the Red Deer River and released more than 122,000 gallons of light crude. Investigators concluded that the pipe was uncovered by scour during high flood waters and subjected to vibrations from the river flow that led a weld to fail.

► Three Enbridge Corp. crude oil pipelines crossing Minnesota's Tamarac River were exposed by floodwater erosion years ago, and were still exposed in mid-2014. None of the pipes had failed at that point, but one was being propped up by steel legs, according to an MPR News account.

Federal regulations aren't much help. The only rule that addresses pipe burial at major river crossings requires petroleum pipelines to be laid at least four feet below the riverbed at the time of construction. Once a pipeline's installed, there are no requirements regarding burial depth. There is no rule requiring exposed pipelines to be reburied, though a spill under those conditions would invite regulatory penalties for leaving the line exposed to hazards.

What's more, federal rules put the pipeline companies in charge of identifying all threats that could cause a spill in highly populated or environmentally sensitive areas, and the companies get wide latitude in deciding what to do about them, according to Rebecca Craven, program manager at the Pipeline Safety Trust, a nonprofit group that tracks pipeline risks and regulations.

"Operators with river crossings are supposed to figure out whether and to what extent scour is a risk," said Craven. "If it turns out that Bridger's line was inadequately protected like the Exxon pipeline was, it shows that we still have a problem with operators not doing adequate risk assessments."

CLICK HERE to enlarge image

YellowstoneRiverPipe800px.jpg
 

Attachments

  • YellowstoneRiverPipe800px_0.jpg
    YellowstoneRiverPipe800px_0.jpg
    59.2 KB · Views: 13
Exxon, for example, concluded that the Silvertip was not at risk during the 2011 floods because the pipeline wasn't damaged in past floods and hadn't recently been affected by scour. Federal regulators fined Exxon $1 million, calling Exxon's assumptions "not reasonable," and warning that the absence of damage in previous floods "does not mean future flooding could never cause a failure."

Indeed, the required four-foot minimum initial burial depth for pipelines can be completely eliminated by natural erosion over time or by a single flood event. Active free-flowing rivers can carve with enough ferocity to lower their riverbeds by 20 feet or shift the waterway onto an entirely new path, which can add new stresses to the pipeline or put the river over pipe that has less cover or lacks reinforcement or protective cement casings.

The hotly debated Keystone XL oil pipeline project would cross nearly 2,000 rivers, streams and reservoirs in Montana, South Dakota and Nebraska, according to one estimate. The route takes the pipe across the Missouri and Yellowstone rivers, where owner TransCanada has pledged to install the pipeline 35 feet below the riverbeds.

But conservationists, river advocates and pipeline opponents aren't reassured. They are especially worried about potential spills in rivers because they are often critical water sources for nearby communities. The iconic Yellowstone River, which has 39 fossil fuel pipelines that cross it or pass through its lateral migration zone, is also home to threatened and endangered wildlife, and a popular destination for fishing and rafting.

Kristi Ponozzo, public policy director at Montana's Department of Environmental Quality, said the state is anxious to put an end to oil releases into the Yellowstone. "We are looking at the situation and trying to figure out what actions could or should be taken to help prevent future spills," she said.

The Poplar Problem

The Poplar pipeline leaked on Jan. 17, sending more than 30,000 gallons of oil into the Yellowstone and contaminating the drinking water for residents of nearby Glendive, Montana. Oil recovery was difficult and dangerous because a layer of ice coated the river at the leak location and for several miles downstream.

Bridger Pipeline last checked the pipeline's burial depth in Sept. 2011 and planned to reassess the crossing in 2016. The 2011 survey showed the Poplar was buried at least eight feet below the river bottom of the river, the company said.

Sonar testing after the spill, however, showed that about 110 feet of the Poplar pipeline was completely uncovered along the bottom of the Yellowstone River. Up to 22 feet of the exposed section is unsupported because river scour created a one-foot deep gap between that part of the pipe and the river floor.

The cause of the spill is not yet known. The Poplar pipeline was built in the 1950s with pipe known to be susceptible to cracks and defects along its lengthwise seams, but the segment under the Yellowstone was replaced in 1967 with seamless pipe.

Stephen Holnbeck, a Helena, Mont.-based hydraulic engineer with the U.S. Geological Survey's Wyoming-Montana Water Science Center, said what's known about the spill so far points to scouring as a key factor.

"The thing probable scoured out sometime between 2011 and this last year's runoff, and it was sitting there exposed, and then there was some straw that broke the camel's back," Holnbeck said. "It could have scoured in 2012 and just been sitting there for the last three years."

Exposed pipe in a large river can be damaged by debris tumbling downstream, boat anchors, and other objects. In addition, long-term contact with the river can accelerate corrosion, and powerful currents can weaken welds or exacerbate defects. In the winter, ice can cause scouring and ice jams can damage unprotected pipelines.

"We were disheartened to learn that the line was exposed on the riverbed," Bridger spokesman Bill Salvin said after the sonar testing. The company is studying the accident and river dynamics, and will apply what it learns "across our system," he said.

The oil pipelines considered most vulnerable are those that are exposed or buried in relatively shallow trenches under active rivers that can flood and erode the riverbed. But each pipeline crossing is unique and constantly changing, and that means a shallow pipeline can be safe in a placid waterway and a deeply buried line can be in danger under a powerful river.

Stewart Rood, a professor who studies river science and dynamics at the University of Lethbridge in Alberta, said river crossings pose special risks for pipeline owners because stream characteristics are constantly changing and sediment can be removed and replaced in cycles.

"The Yellowstone's a big river, so eight feet doesn't sound like a lot to me," Rood said. "Because of the dynamic nature of a river, it is always eroding, always moving, and always eating away at the bed."

Call for New Federal Rules

Three years ago, after Exxon's Silvertip broke open, Montana's governor formed a pipeline safety council to scrutinize the petroleum pipelines that cross the state's key waterways. A separate group, led by the Yellowstone River Conservation District Council, used grant money to compile a pipeline river crossing database and produce a report that assigned risk levels to each of the major petroleum pipeline crossings along the Yellowstone.

Both of the state groups sought and received help and data from the federal Pipeline and Hazardous Materials Safety Administration (PHMSA), the primary regulator for U.S. pipelines carrying oil and other hazardous liquids. PHMSA conducted the nearly 90 river crossing inspections in Montana that revealed more than 20 vulnerable crossings.

Exxon, CHS, and Phillips 66 reburied pipelines at 12 river or creek crossings, using horizontal directional drilling to place the pipes substantially deeper. Several other pipeline crossings were strengthened with added cover, or other reinforcement.

Bridger's Poplar pipeline crossing was initially labeled a "moderate risk" for dangerous scouring by the state's risk assessment report, which relied on pipeline companies for some data. An updated version downgraded the site to "low risk," noting that the pipeline crossing had five feet of cover and that Bridger was monitoring it. It's unclear why the report cites five feet of covering, a shallower figure than the company's statement that the pipeline was at least eight feet below the riverbed at last check.

Both depth numbers exceed PHMSA's four-foot burial guidance for rivers that are more than 100 feet wide. Pipelines that cross smaller waterways need only be 30 inches below the river bottom at the time of construction.

"It's pretty apparent on the Yellowstone that the [federal] criteria for the trenched pipelines have failed us twice now," said Karin Boyd, a consultant and expert on fluvial geomorphology, or river processes, who worked on the Montana risk assessment report. "There was this much cover on the Bridger pipeline. People thought it was OK and it wasn't."

Bosse of American Rivers, said the federal rules aren't adequate.

For pipelines that cross rivers, he said, "safety standards need to be especially rigid…and pipelines need to be drilled very deep down under the bed of the river so they're not exposed to flooding."

But PHMSA, the agency that regulates pipelines, has issued a series of bulletins warning pipeline companies about the issue, and doesn't think new rules are needed.

After the Silvertip spill, Congress asked the agency to take stock of the river scouring problem and to decide whether PHMSA needed new regulations to address the issue.

In November 2013, Cynthia Quarterman, then-director of PHMSA, told Congress that depletion of cover played a role in 16 pipeline incidents between 1991 and October 2012, and amounted to just 0.3 percent of all hazardous liquids pipeline incidents in its database for that period.

PHMSA rules already require pipeline operators to assess and address all risks that could reduce the safety of the pipeline or cause it to fail, Quarterman said. Those risks include "flooding and lack of cover" in water crossings.

The Association of Oil Pipe Lines, a trade group that represents pipeline owners, backs the agency's conclusion.

"It’s a concern, and we need to have a law on the books, and we do. And we need to have regs on the books, and we do," said AOPL spokesman John Stoody. "But it's such a rare occurrence overall, that it's something we have to think hard about, because we don't want to divert safety spending away from something else that’s more frequent or has a bigger impact on human health and the environment."

Craven at the Pipeline Safety Trust is hopeful that, even without new rules, pipeline operators will be more vigilant about the threats at pipeline river crossings, and recognize that unexpected events can and do happen.

"Even in little creeks there's constant bedload movement, and given the right circumstances, you can get scouring under the creek," said Craven. "It happened to a little creek in Indiana. It had a flood one winter and it just changed course and all of the sudden, there's a pipeline there completely exposed."
 
CMIP5 Modeling of the Western Tropical Pacific Climate System

Paper Reviewed
Grose, M.R., Brown, J.N., Narsey, S., Brown, J.R., Murphy, B.F., Langlais, C., Gupta, A.S., Moise, A.F. and Irving, D.B. 2014. Assessment of the CMIP5 global climate model simulations of the western tropical Pacific climate system and comparison to CMIP3. International Journal of Climatology 34: 3382-3399.

In introducing their publication in the Royal Meteorological Society's International Journal of Climatology, Grose et al. (2014) write that "an important influence on confidence in model projections is the realism with which the models simulate the current climate mean and variability." And they note, in this regard, that "while models are now sufficiently reliable to provide useful insights into many aspects of the climate system in the region, systematic biases in the simulation of some important features in the Pacific region persist." So what are these still-unresolvable biases? And how significant are they?

Quoting the nine Australian researchers, "there is evidence to reject one model as unsuitable for making climate projections in the region, and another two models unsuitable for analysis of the South Pacific Convergence Zone (SPCZ)." And they add that "many of the systematic model biases in the mean climate in CMIP3 are also present in the CMIP5 models," specifically identifying "biases in the position and orientation of the SPCZ and Inter-Tropical Convergence Zone, as well as the spatial pattern, variability and teleconnections of the West Pacific monsoon, and the simulation of El Niño Southern Oscillation." In addition, they indicate that unresolved problems also prohibit successful modeling of the region's cold tongue and the West Pacific monsoon, further adding that there are still "several regions in the world where CMIP5 models show significant differences to observed trends in temperature and mean sea level pressure."

As for the significance of these many biases in the current crop of CMIP5 models, one can get a sense of their importance in Grose et al.'s concluding opinion that "all projections must account for the uncertainty introduced by the presence of these biases."

Posted 6 February 2015
 
No discussion? No admitting of any valid logic?

Guess I can't expect that. Thanks for keeping it civil at least OBD.

You are welcome, same to you. Cannot say that for others though.

to be honest -I guess I post here not because I believe I can change your mind OBD. That is pretty firmly made-up regardless of any objective and valid points I make.

You never know, this is not about you not having good ideals or thoughts.
This is about the fact that there is another side and you and others through your attitudes have shown you do not think there is and that anyone who does is stupid and ignorant.
Trust me , you are wrong about that. There are many people who are way smarter than anyone on this site and I include myself, who disagree with MAN MADE GLOBAL WARMING via CO2.
They do not disagree with global warming as that is and always will be.


No - I post because maybe someone else reading this can see where the logical and rational arguments are - are where the emotional fear-based propaganda lies. Where the lies lie.

Well there are lots of lies on your side and they are now being outed.

For myself - I REFUSE to give-up my rational thinking skills. I REFUSE to be intimidated or lied to. That is why I enjoy Science. It is a truth-seeking vocation. Only those unfamiliar with Science don't understand this.


What do you do when science is proven wrong over and over?
What about what is now coming out about them manipulating temperatures?
Making up temperatures where there were no thermometers?

Lets - for just a moment - decide that global warming is a hoax.

What's the worst that could happen if we cut back on our hydrocarbon consumption?

We are already due to science.

Hmmmm......

We extend our limited hydrocarbon supply maybe a generation or two longer than we will when we run out of it - and make no mistake - we will run out of hydrocarbons in some generation near you.

Then we will use water.


That's sounds ok, right?

We decrease the amount of mercury and other contaminants in our air, soil, and water.

Wow! That can't be a bad thing either, right?
Right.

We create - "jobs, jobs, jobs"!!!

Gee - That doesn't sound like a bad thing, either.

Ok - so what do you have against leaving the world a better place when you leave it, OBD? What's your legacy? How is cutting back on hydrocarbon consumption and increasing our reliance on renewable resources a BAD thing? Why are you arguing against doing this? Are you that truly scared of change Are you that truly scared of change that you ignore the logic above??

This is not about us here, this is about the rest of the world.
Do you think that you are allowed to have a better life than anyone else? Well you do by a stretch.
So do your science and find out what they really want to do. It has nothing to do with CO2.
 
Here you go.


UN Climate Chief Announces "We Are Remaking The World Economy"
Thu, Feb 5, 2015 3:45 PM EST 0:49
Wochit
The United Nation’s climate chief says that reordering the global economy to fight climate change is the “most difficult” task the international body has ever undertaken. Christiana Figueres, who heads up the U.N.’s Framework Convention on Climate Change, told reporters, “This is probably the most difficult task we have ever given ourselves, which is to intentionally transform the economic development model, for the first time in human history." Figueres continued, “This is the first time in the history of mankind that we are setting ourselves the task of intentionally, within a defined period of time, to change the economic development model that has been reigning for at least 150 years--since the industrial revolution
 
Satellites: Warming pause continues & 2014 not the hottest


There was nothing special about the temperature of the Earth in 2014. In fact, there has been no meaningful warming since last century.

This is true no matter what set of temperature data you examine.

However, when you examine the data recorded from satellites, the flaws in the warming narrative become even clearer.

Satellites are considered by many to be the best available source of temperature data. Local measurements are subject to many sorts of errors. Temperature stations tend to be located near population centers where they are subject to the urban heat island effect. Weather balloons, temperature stations and buoys leave huge gaps in coverage. Climate researchers then fill in the their best guesses as to what temperature should be for the huge areas where no readings exist. This creates opportunity for honest error — or worse.

Satellites, on the other hand, record temperatures over the entire Earth. Their coverage is more complete and the data they yield is much more difficult to manipulate.

RSS sattelite graph 2014 not the warmest pause continues

The graph above shows us that there has been no meaningful warming since the 1990′s. Today’s school children have never lived in a warming world.

The graph below shows how badly 33 UN IPCC climate models fare when compared against actual measurements. Keep in mind that the earlier period, when the models and temperatures appear to line up, is from before the models were created.

Hindsight we know is 20/20.

RSS satellites v 33 UN climate models


After the models were created, and we were told told the whole thing was settled, global temperatures inconveniently remained cooler than projected.

Go ahead, examine the data for yourself. Compare it to the computer model projections.

That’s what the warming crowd fears most.
 

Attachments

  • image.jpg
    image.jpg
    29 KB · Views: 36
‘BREATHTAKING’ ADJUSTMENTS TO ARCTIC TEMPERATURE RECORD. IS THERE ANY ‘GLOBAL WARMING’ WE CAN TRUST?


Here’s a video that you absolutely must see.

Not, I hasten to warn you, because it’s exciting, well-produced or informative; rather, because of the fascinating light it sheds on the debate about global warming in general and also, in particular, on the ongoing controversy about whether organisations like NASA and NOAA are playing fast and loose with the world’s temperature data sets.

According to the video’s creator and star, Dr Kevin Cowtan, the latter suggestion is a nonsense. Using charts of South American and global temperatures, he painstakingly refutes suggestions by Christopher Booker and also (though tragically I don’t get a mention) by me that there is anything suspect, let alone corrupt or fraudulent, in the adjustments that NASA and NOAA have been making to the raw temperature data from weather stations around the world.

If you stumbled on it by accident on YouTube I think you’d be quite persuaded. Cowtan’s tone is soft and reasonable; the science, as he presents it, seems to stack up: a) there are perfectly valid reasons for these adjustments, to do with homogenising the raw data when it looks out of kilter with neighbouring but possibly more accurate weather stations, and with the changing nature of measuring equipment and b) the adjustments are, in any case, minor – altering the raw data by no more than 3 per cent.

When you Google “Dr Kevin Cowtan” he appears reassuringly neutral in this affair. He works in the Department of Chemistry at the University of York, his current speciality being X-ray crystallography. A proper scientist, then, with no dog in this fight. Or so it looks until you scroll down a bit and see that his other area of research is “climate science.”

My climate science research focuses primarily on problems which are relevant to the public understanding of climate science. With my colleague Robert Way I have been investigating biases in historical temperature record from weather stations. Our primary work concerns temperature change over the past two decades. The main temperature record providers show a slowdown in the rate of warming over this period, however when biases in the temperature record are taken into account, we find that part of the slowdown disappears.

I am also involved in climate science communication, and am contributing to a massive online course run by the University of Queensland. I can offer undergraduate projects in this area for students who are interested to develop science communication skills.

So, not a neutral party after all then, but someone who depends for part of his livelihood on the lavish funding available in academe for those who promote the climate “consensus.” Perhaps, in the interests of full disclosure, he might have mentioned this detail on his YouTube biography. But I mean that only as a very mild and largely inconsequential criticism. What matters is not what Cowtan does for a living (“the motive fallacy”) but whether or not he has got his facts right.

And according to this counterblast from Dave Burton – a US computer programmer, sea level specialist and IPCC expert reviewer on AR5 – he hasn’t.

Burton’s key point is this: where Cowtan claims that all NOAA’s adjustments have done is increased warming by a modest 3 per cent, in actuality they have increased it by 35 per cent. So, far from Cowtan’s assessment that these adjustments are “inconsequentially tiny”, they are in fact quite massively distorting.

Might it be that they reached such wildly different conclusions by using different data? Er, no. Burton reached his conclusions by creating a spreadsheet with decadal data digitized from the exact graph used in Cowtan’s video.

Now I appreciate that in the context of the broader climate debate this might seem a trivial dispute. But I’ve been at this game long enough to be able to assure you that these faux rebuttals like the one offered by Cowtan are absolutely integral to the ongoing survival of the alarmist ‘consensus.’

As far as the warmist propaganda machine is concerned it really doesn’t matter two hoots whether or not Cowtan has got his facts right. What matters is that whenever the inconvenient subject of doctored temperature data crops up again, the alarmists have their ready-made get out. From a proper actual scientist. So he must know – right?

You can be sure that, if it hasn’t already, Cowtan’s dodgy rebuttal video will soon be linked to by the usual warmist sockpuppeteers in the comment threads below every relevant article. What none of them will mention, of course, is the Burton counter-rebuttal to the Cowtan rebuttal. Integrity has never been these people’s strong point. It’s winning the propaganda war that counts.

Meanwhile, in the real world, the case for a fraud trial against the climate data record gatekeepers seems to be getting stronger and stronger.

Paul Homewood, the blogger who noticed the discrepancies with the Paraguay temperature records, has now turned his attention to the Arctic region. His conclusion after studying the charts before and after is that the scale and geographic range of these adjustments is “breathtaking.”

In nearly every Arctic station from Greenland in the West to Siberia in the East, the data has been adjusted to make the warm period in the 1930s look cooler than it actually was. This, of course, has the effect of making the Twentieth Century warming look much more dramatic than the raw data would suggest.

Will this scandalous apparent evidence-tampering ever get much coverage in the mainstream media? It certainly ought to. Think about it: if Homewood (and Anthony Watts and Steven Goddard, et al) are correct, then what it essentially means is that the entire global warming scare has been sold to us on a false prospectus.

But it won’t, of course, because the mainstream media – in large part, at least – remains wedded to the Man Made Global Warming orthodoxy and therefore only really likes to run stories that prove how totally wrong, evil, and swivel-eyed climate change deniers are.

For example, this story in Nature, which sought to explain away one of the most embarrassing problems the warmist camp has been suffering of late: the abject failure of their fancy computer models to have predicted the planet’s failure to warm since 1998.

According to the lead author of this widely reported study, one Jochem Marotzke of the Max Planck Institute, it dealt a fatal blow to the sceptics’ case that the warmists’ computer models were a waste of space.

Unfortunately for Marotzke, his case has now, in turn, been demolished in this article by Nic Lewis.

Professor Gordon Hughes, one of the statisticians who reviewed and confirmed Lewis’s findings has commented thus:

“The statistical methods used in the [Marotzke] paper are so bad as to merit use in a class on how not to do applied statistics. All this paper demonstrates is that climate scientists should take some basic courses in statistics and Nature should get some competent referees.”

Damning indeed.

But here’s a prediction. The rebuttal won’t receive nearly the coverage that Marotzke’s original inept paper did.
 
This is about the fact that there is another side and you and others through your attitudes have shown you do not think there is and that anyone who does is stupid and ignorant. What do you do when science is proven wrong over and over?
Well, OBD - as far as the science goes - No actually, there is not "another side". I think Imhofe might be as you described due to his terribly stupid and ignorant remarks - but no - I don't think anyone who disagrees with the science on climate change is "stupid and ignorant" - I think they either 1/ lack critical science literacy and critical thinking skills (often related parameters), or 2/ get paid to lie from big oil and coal.

Let me explain.

You want to present "another side". I agree politically there is another side - again - when one follows the $ - comes from big oil and coal. They have what one calls a "vested interest" in disputing climate change science. Business as usual is what they want.

Then there are quite a number of lies generated by this side. One of them happens to be that climate change is a hoax - generated by those evil characters in lab coats because they have a particular bent in destroying the hydrocarbon industry. They besmirch the reputations of hundred of thousands of well-intentioned, intelligent, dedicated people - w/o even looking at the science.

This is one of those lies I would describe as stupid and ignorant. I will tell you why.

People get into the Sciences because they search for truth. They see patterns in the data, and want to find out why. That's what drives them. Only those unfamiliar with Science - and those willfully wishing to perpetrate a lie - either don't understand this - or don't want to.

Let's look at the guy who 1st realized what the implications of increasing levels of CO2 might mean. From: http://en.wikipedia.org/wiki/Keeling_Curve

"Charles David Keeling, of Scripps Institution of Oceanography at UC San Diego, was the first person to make frequent regular measurements of the atmospheric carbon dioxide (CO2) concentration, taking readings at the South Pole and in Hawaii from 1958 onwards

Prior to Keeling, the concentration of carbon dioxide in the atmosphere was thought to be affected by constant variability. Keeling had perfected the measurement techniques and observed "strong diurnal behavior with steady values of about 310 ppm in the afternoon" at three locations: (Big Sur near Monterey, the rain forests of Olympic Peninsula and high mountain forests in Arizona).[3] By measuring the ratio of two isotopes of carbon, Keeling attributed the diurnal change to respiration from local plants and soils, with afternoon values representative of the "free atmosphere". By 1960, Keeling and his group had determined that the measurement records from California, Antarctica, and Hawaii were long enough to see not just the diurnal and seasonal variations, but also a year-on-year increase that roughly matched the amount of fossil fuels burned per year. In the article that made him famous, Keeling observed, "at the South Pole the observed rate of increase is nearly that to be expected from the combustion of fossil fuel".[4]
"

I attached the graph of his data below.

He didn't get a job to try to create a "hoax". He saw patterns in the data, OBD. So do hundreds of thousands of other scientists.

Do you have any idea of how hard it is to get consensus in the Sciences?

I would say that you do not - given your past posts. Again - it is really unfortunate that the converts to the denier camp seem to have such limited Science literacy.

Not just "consensus" - but some ~97% consensus.

Scientists are a very cautious lot. They argue among themselves all the time. A 97% consensus is almost unheard of. It's obvious that you don't recognize how strongly this validates the data.

YET - in the denier camp - they want you to believe there is "another side".

There may be - but that side is not Science. It is religion. The religion of big oil and coal.

{when}...we will run out of hydrocarbons ...Then we will use water.
OBD - water - by itself - is not a source of energy - with the exception of latent/potential energy in RoR and Dams. To split water into hydrogen and oxygen - you need electrical energy generated somehow.

yes, as part of the renewable energy infrastructure - including wind, solar, and geothermal - dams and RoR projects will be a component. The sooner we get developing this infrastructure - the longer our hydrocarbon supplies will last - and the slower the CO2 levels and temperatures will rise.

That is what these geeks in lab coats are recommending OBD - and have been for some time.

The response so far from the denier camp - It's all a mass hoax.

Speaking of geeks...Bill Gates.

Bill Gates is even more rich than the Koch idiots.

He - unlike the Koches - has a foundation http://www.gatesfoundation.org/ that funds communities with disease issues, fresh water issues, agriculture issues, education, etc. I think he will have quite a legacy when he dies.

The Koch's on the other hand - covertly fund a pile of right-wing think tanks that lie and cherry-pick data to confuse people so they can carry on business as usual. Quite a legacy alright. A completely different one than Gates. Not sure what they think their lives on this planet are all about.

You are quite welcome to blindly cut and paste their crap if you want to OBD - rather than reading the actual science and making your own mind up. Just keep in mind that what you are posting - is not Science.
 

Attachments

  • TheKeeingCurveJan2015.jpg
    TheKeeingCurveJan2015.jpg
    18.7 KB · Views: 32
Last edited by a moderator:
http://www.nytimes.com/2014/11/03/w...html?partner=rss&emc=rss&smid=tw-nytimes&_r=0

U.N. Panel Issues Its Starkest Warning Yet on Global Warming
By JUSTIN GILLISNOV. 2, 2014
Photo

Machines digging for brown coal in front of a power plant near Grevenbroich, Germany, in April. Credit Martin Meissner/Associated Press
Continue reading the main storyContinue reading the main storyShare This Page


COPENHAGEN — The gathering risks of climate change are so profound that they could stall or even reverse generations of progress against poverty and hunger if greenhouse emissions continue at a runaway pace, according to a major new United Nations report.

Despite growing efforts in many countries to tackle the problem, the global situation is becoming more acute as developing countries join the West in burning huge amounts of fossil fuels, the Intergovernmental Panel on Climate Change said here on Sunday.

Failure to reduce emissions, the group of scientists and other experts found, could threaten society with food shortages, refugee crises, the flooding of major cities and entire island nations, mass extinction of plants and animals, and a climate so drastically altered it might become dangerous for people to work or play outside during the hottest times of the year.

“Continued emission of greenhouse gases will cause further warming and long-lasting changes in all components of the climate system, increasing the likelihood of severe, pervasive and irreversible impacts for people and ecosystems,” the report found.

In the starkest language it has ever used, the expert panel made clear how far society remains from having any serious policy to limit global warming.

Doing so would require leaving the vast majority of the world’s reserves of fossil fuels in the ground or, alternatively, developing methods to capture and bury the emissions resulting from their use, the group said.

If governments are to meet their own stated goal of limiting the warming of the planet to no more than 3.6 degrees Fahrenheit, or 2 degrees Celsius, above the preindustrial level, they must restrict emissions from additional fossil-fuel burning to about 1 trillion tons of carbon dioxide, the panel said. At current growth rates, that budget is likely to be exhausted in something like 30 years, possibly less.

Yet energy companies have booked coal and petroleum reserves equal to several times that amount, and they are spending some $600 billion a year to find more. Utilities and oil companies continue to build coal-fired power plants and refineries, and governments are spending another $600 billion or so directly subsidizing the consumption of fossil fuels.

In the United States, federal investments in energy research have never come close to those in areas that are high priorities. Military research is greater than that in all these areas combined.Panel’s Latest Warming Warning Misses Global Slumber Party on Energy ResearchNOV. 2, 2014

By contrast, the report found, less than $400 billion a year is being spent around the world to reduce emissions or otherwise cope with climate change. That is a small fraction of the revenue spent on fossil fuels — it is less, for example, than the revenue of a single American oil company, ExxonMobil.

The new report comes just a month before international delegates convene in Lima, Peru, to devise a new global agreement to limit emissions, and it makes clear the urgency of their task.

Appearing Sunday morning at a news conference in Copenhagen to unveil the report, the United Nations secretary general, Ban Ki-moon, appealed for strong action in Lima.

“Science has spoken. There is no ambiguity in their message,” Mr. Ban said. “Leaders must act. Time is not on our side.”

Yet there has been no sign that national leaders are willing to discuss allocating the trillion-ton emissions budget among countries, an approach that would confront the problem head-on, but also raise deep questions of fairness. To the contrary, they are moving toward a relatively weak agreement that would essentially let each country decide for itself how much effort to put into limiting global warming, and even that document would not take effect until 2020.

“If they choose not to talk about the carbon budget, they’re choosing not to address the problem of climate change,” said Myles R. Allen, a climate scientist at Oxford University in Britain who helped write the new report. “They might as well not bother to turn up for these meetings.”

The Intergovernmental Panel on Climate Change is a scientific body appointed by the world’s governments to advise them on the causes and effects of global warming, and potential solutions. The group, along with Al Gore, was awarded the Nobel Peace Prize in 2007 for its efforts to call attention to the climate crisis.

The new report is a 175-page synopsis of a much longer series of reports that the panel has issued over the past year. It is the final step in a five-year effort by the body to analyze a vast archive of published climate research.

It is the fifth such report from the group since 1990, each finding greater certainty that the climate is warming and that human activities are the primary cause.

“Human influence has been detected in warming of the atmosphere and the ocean, in changes in the global water cycle, in reductions in snow and ice, and in global mean sea-level rise; and it is extremely likely to have been the dominant cause of the observed warming since the mid-20th century,” the report said.

A core finding of the new report is that climate change is no longer a distant threat, but is being felt all over the world. “It’s here and now,” Rajendra K. Pachauri, the chairman of the panel, said in an interview. “It’s not something in the future.”

The group cited mass die-offs of forests, such as those killed by heat-loving beetles in the American West; the melting of land ice virtually everywhere in the world; an accelerating rise of the seas that is leading to increased coastal flooding; and heat waves that have devastated crops and killed tens of thousands of people.

The report contained the group’s most explicit warning yet about the food supply, saying that climate change had already become a small drag on overall global production, and could become a far larger one if emissions continued unchecked.

A related finding is that climate change poses serious risks to basic human progress, in areas such as alleviating poverty. Under the worst-case scenarios, factors like high food prices and intensified weather disasters would most likely leave poor people worse off. In fact, the report said, that has already happened to a degree.

In Washington, the Obama administration welcomed the report, with the president’s science adviser, John P. Holdren, calling it “yet another wake-up call to the global community that we must act together swiftly and aggressively in order to stem climate change and avoid its worst impacts.”

The administration is pushing for new limits on emissions from American power plants, but faces stiff resistance in Congress and some states.

Michael Oppenheimer, a climate scientist at Princeton University and a principal author of the new report, said that a continuation of the political paralysis on emissions would leave society depending largely on luck.

If the level of greenhouse gases were to continue rising at a rapid pace over the coming decades, severe effects would be avoided only if the climate turned out to be far less sensitive to those gases than most scientists think likely, he said.

“We’ve seen many governments delay and delay and delay on implementing comprehensive emissions cuts,” Dr. Oppenheimer said. “So the need for a lot of luck looms larger and larger. Personally, I think it’s a slim reed to lean on for the fate of the planet.”

A version of this article appears in print on November 3, 2014, on page A8 of the New York edition with the headline: U.N. Panel Issues Its Starkest Warning Yet on Global Warming. Order Reprints| Today's Paper|Subscribe
 
Last edited by a moderator:
Massive climate funding exposed

Climate Money

The Climate Industry: $79 billion so far – Trillions to come


For the first time, the numbers from government documents have been compiled in one place. It’s time to start talking of “Monopolistic Science”. It’s time to expose the lie that those who claim “to save the planet” are the underdogs. And it’s time to get serious about auditing science, especially when it comes to pronouncements that are used to justify giant government programs and massive movements of money. Who audits the IPCC?

The Summary

The US government has provided over $79 billion since 1989 on policies related to climate change, including science and technology research, foreign aid, and tax breaks.
Despite the billions: “audits” of the science are left to unpaid volunteers. A dedicated but largely uncoordinated grassroots movement of scientists has sprung up around the globe to test the integrity of the theory and compete with a well funded highly organized climate monopoly. They have exposed major errors.
Carbon trading worldwide reached $126 billion in 2008. Banks are calling for more carbon-trading. And experts are predicting the carbon market will reach $2 – $10 trillion making carbon the largest single commodity traded.
Meanwhile in a distracting sideshow, Exxon-Mobil Corp is repeatedly attacked for paying a grand total of $23 million to skeptics—less than a thousandth of what the US government has put in, and less than one five-thousandth of the value of carbon trading in just the single year of 2008.
The large expenditure in search of a connection between carbon and climate creates enormous momentum and a powerful set of vested interests. By pouring so much money into one theory, have we inadvertently created a self-fulfilling prophesy instead of an unbiased investigation?

Read the Full Report at the Science and Public Policy Institute.

There doesn’t necessarily need to be a conspiracy. It doesn’t require any centrally coordinated deceit or covert instructions to operate. Instead it’s the lack of funding for the alternatives that leaves a vacuum and creates a systemic failure. The force of monopolistic funding works like a ratchet mechanism on science. Results can move in both directions, but the funding means that only results from one side of the equation get “traction”.

Billions in the Name of “Climate”

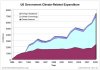
In total, over the last 20 years, by the end of fiscal year 2009, the US government will have poured in $32 billion for climate research—and another $36 billion for development of climate-related technologies. These are actual dollars, obtained from government reports, and not adjusted for inflation. It does not include funding from other governments. The real total can only grow.

In 1989, the first specific US climate-related agency was created with an annual budget of $134 million. Today in various forms the funding has leapt to over $7,000 million per annum, around 50 fold higher. Tax concessions add to this. (See below for details and sources.)

..after spending $30 billion on pure science research no one is able to point to a single piece of empirical evidence…
This tally is climbing precipitously. With enormous tax breaks and rescue funds now in play, it’s difficult to know just how far over the $7 billion mark the final total will stand for fiscal year 2009. For example, additional funding for carbon sequestration experiments alone amounted to $3.4 billion in the American Recovery and Reinvestment Act of 2009 (not included in the $7 billion total above).

The most telling point is that after spending $30 billion on pure science research no one is able to point to a single piece of empirical evidence that man-made carbon dioxide has a significant effect on the global climate.

If carbon is a minor player in the global climate as the lack of evidence suggests, the “Climate Change Science Program” (CCSP), “Climate Change Technology Program” (CCTP), and some of the green incentives and tax breaks would have less, little, or no reason to exist. While forecasting the weather and climate is critical, and there are other good reasons to develop alternative energy sources—no one can argue that the thousands of players who received these billions of dollars have any real incentive to “announce” the discovery of the insignificance of carbon’s role.


Click on the graph for a larger image.


“Thousands of scientists have been funded to find a connection between human carbon emissions and the climate. Hardly any have been funded to find the opposite. Throw 30 billion dollars at one question and how could bright, dedicated people not find 800 pages worth of connections, links, predictions, projections and scenarios? (What’s amazing is what they haven’t found: empirical evidence.)”

By setting up trading networks, tax concessions, and international bureaucracies before the evidence was in, have we ensured that our understanding of the role of carbon in climate science would be sped up, but that our knowledge of every other aspect of climate science would be slowed down to an equal and opposite extent?

Monopolistic funding creates a ratchet effect where pro-AGW findings are reported and repeated, while anti-AGW results lie unstudied and ignored.
Monopolistic funding creates a ratchet effect where even the most insignificant pro-AGW findings are reported, repeated, trumpeted and asserted, while any anti-AGW results lie unstudied, ignored and delayed. Auditing AGW research is so underfunded that for the most part it is left to unpaid bloggers who collect donations from concerned citizens online. These auditors, often retired scientists, are providing a valuable free service to society, and yet, in return they are attacked, abused, and insulted.

The truth will come out in the end, but how much damage will accrue while we wait for volunteers to audit the claims of the financially well-fed?

The stealthy mass entry of bankers and traders into the background of the scientific “debate” poses grave threats to the scientific process. The promise of “trillions of dollars” on commodity markets—with all of that potential money hinging on finding that human emissions of carbon dioxide have a significant role in the climate—surely acts like blanket of mud over open dispassionate analysis.

All of this means we must be extra diligent in only focusing on just the evidence, the science, the empirical data. Illogic and unreason cloud a debate already loaded with bias. When there are so many incentives encouraging unclarity and overcomplexity, the simple truths need help to rise to the top. But who funds the counter-PR campaign—now that even Exxon has been howled out of the theater of science. There is hardly any money promoting Natural Causes of Climate Change, while billions upon trillions promote Unnatural Forces.

In this scientific debate, one side is gagged while the other side has a government-funded media campaign.

The bottom line

Even if monopolistic funding has affected science, the total amount of money paid to each side won’t tell us whether The Planet’s climate is warming or whether that warming is due to carbon-dioxide. The point of this report is to show how the process of science can be distorted (like any human endeavor) by a massive one-sided input of money. What use would money be, if it didn’t have some impact?

The massive amounts of money involved only makes it more imperative that we look hard at the empirical evidence.

by Joanne Nova
Science and Public Policy Institute

U.S. Government Funding for Climate Change Related Activities 1989-2009

(Millions of Dollars)

. Fiscal Year . Climate Science . Climate Technology . Foreign Assistance . Tax Breaks . Annual Total
1989 134 $134
1990 659 $659
1991 954 $954
1992 1,110 $1,110
1993 1,326 845 201 $2,372
1994 1,444 1,038 186 $2,668
1995 1,760 1,283 228 $3,271
1996 1,654 1,106 192 $2,952
1997 1,656 1,056 164 $2,876
1998 1,677 1,251 186 $3,114
1999 1,657 1,694 325 $3,676
2000 1,687 1,793 177 $3,657
2001 1,728 1,675 218 $3,621
2002 1,667 1,637 224 $3,528
2003 1,766 2,533 270 580 $4,569
2004 1,975 2,870 252 500 $5,097
2005 1,865 2,808 234 369 $4,907
2006 1,691 2,789 249 1160 $4,729
2007 1,825 3,441 188 1730 $5,454
2008 1,832 3,917 212 * 1420 * $5,961
2009 2,441 * 4,400 * 579 * 1160 * $7,420
TOTAL $32,508 + $36,136 + $3,506 + $6,919 = $79,069
*Estimate or Request.………..Annual Spending totals (right hand col) do not include Tax breaks.
References:

Climate Change Science Program, Annual Report to Congress: Our Changing Planet http://downloads.climatescience.gov/ocp/ocp2009/ocpfy2009-8.pdf
Analytical Perspectives Budget of the US Government, Fiscal Year 2010. http://www.whitehouse.gov/omb/budget/fy2010/assets/spec.pdf
1993-2005 GAO, Federal Reports on Climate Change Funding Should be Clearer and More Complete http://www.gao.gov/new.items/d05461.pdf Appendix II page 34.
OMB, Fiscal Year 2008. Report to Congress on Federal Climate Change Expenditures, Table 8. http://www.whitehouse.gov/omb/legislative/fy08_climate_change.pdf
Atmospheric Sciences and Climate Change Programs in the FY 2009 Budget, p 1. AAAS. http://www.aaas.org/spp/rd/09pch15.pdf.
 

Attachments

  • image.jpg
    image.jpg
    43.1 KB · Views: 23
http://www.onearth.org/earthwire/bl...e=fb&utm_medium=post&utm_campaign=socialmedia

SEEING THE SILVER LINING
Trending: greenhouse gas emissions are down and renewables are up.

BY SUSAN COSIER | @SUSANCOSIER | 1 day ago

Encouraging news on the climate change front! (No, seriously.) Bloomberg New Energy Finance, a group that analyzes the industry, just released its Sustainable Energy in America Factbook, and according to the report, we’ve made some really important progress in recent years.

For one, our greenhouse gas emissions from the energy sector, which account for 83 percent of the country's carbon output, are down about 9 percent since 2007. That’s thanks to advances in energy efficiency and changes to how we generate electricity. Which brings us to another great development: Wind and solar have tripled their capacity since 2008. Keep up the good work, America! (No, seriously.)
 

Attachments

  • screen-shot-2015-02-04-at-11.23.39-am.jpg
    screen-shot-2015-02-04-at-11.23.39-am.jpg
    57.4 KB · Views: 22
  • screen-shot-2015-02-04-at-10.45.18-am.jpg
    screen-shot-2015-02-04-at-10.45.18-am.jpg
    76.1 KB · Views: 22
I like it that you think you know everything that is good for us. Yet when I go through your posts they do not use science let alone peer reviewed science.
So show me the peer reviewed science that the satellights are wrong about the earths temperatures and the reason for this?
Show me why the world has not warmed up for 18 years plus and your science that says so.
Tell me why I can so easily find all your scientists projections for the future and see they are wrong.
Your and others postings are as mine taken from the web.
You say that man is responsible for this? Show me the facts.
Tell me what you would tell the other people in the world who do not have the life you do that they should do?
Tell me what China and India as an example should do right now.


Well, OBD - as far as the science goes - No actually, there is not "another side". I think Imhofe might be as you described due to his terribly stupid and ignorant remarks - but no - I don't think anyone who disagrees with the science on climate change is "stupid and ignorant" - I think they either 1/ lack critical science literacy and critical thinking skills (often related parameters), or 2/ get paid to lie from big oil and coal.

Let me explain.

You want to present "another side". I agree politically there is another side - again - when one follows the $ - comes from big oil and coal. They have what one calls a "vested interest" in disputing climate change science. Business as usual is what they want.

Then there are quite a number of lies generated by this side. One of them happens to be that climate change is a hoax - generated by those evil characters in lab coats because they have a particular bent in destroying the hydrocarbon industry. They besmirch the reputations of hundred of thousands of well-intentioned, intelligent, dedicated people - w/o even looking at the science.

This is one of those lies I would describe as stupid and ignorant. I will tell you why.

People get into the Sciences because they search for truth. They see patterns in the data, and want to find out why. That's what drives them. Only those unfamiliar with Science - and those willfully wishing to perpetrate a lie - either don't understand this - or don't want to.

Let's look at the guy who 1st realized what the implications of increasing levels of CO2 might mean. From: http://en.wikipedia.org/wiki/Keeling_Curve

"Charles David Keeling, of Scripps Institution of Oceanography at UC San Diego, was the first person to make frequent regular measurements of the atmospheric carbon dioxide (CO2) concentration, taking readings at the South Pole and in Hawaii from 1958 onwards

Prior to Keeling, the concentration of carbon dioxide in the atmosphere was thought to be affected by constant variability. Keeling had perfected the measurement techniques and observed "strong diurnal behavior with steady values of about 310 ppm in the afternoon" at three locations: (Big Sur near Monterey, the rain forests of Olympic Peninsula and high mountain forests in Arizona).[3] By measuring the ratio of two isotopes of carbon, Keeling attributed the diurnal change to respiration from local plants and soils, with afternoon values representative of the "free atmosphere". By 1960, Keeling and his group had determined that the measurement records from California, Antarctica, and Hawaii were long enough to see not just the diurnal and seasonal variations, but also a year-on-year increase that roughly matched the amount of fossil fuels burned per year. In the article that made him famous, Keeling observed, "at the South Pole the observed rate of increase is nearly that to be expected from the combustion of fossil fuel".[4]
"

I attached the graph of his data below.

He didn't get a job to try to create a "hoax". He saw patterns in the data, OBD. So do hundreds of thousands of other scientists.

Do you have any idea of how hard it is to get consensus in the Sciences?

I would say that you do not - given your past posts. Again - it is really unfortunate that the converts to the denier camp seem to have such limited Science literacy.

Not just "consensus" - but some ~97% consensus.

Scientists are a very cautious lot. They argue among themselves all the time. A 97% consensus is almost unheard of. It's obvious that you don't recognize how strongly this validates the data.

YET - in the denier camp - they want you to believe there is "another side".

There may be - but that side is not Science. It is religion. The religion of big oil and coal.

OBD - water - by itself - is not a source of energy - with the exception of latent/potential energy in RoR and Dams. To split water into hydrogen and oxygen - you need electrical energy generated somehow.

yes, as part of the renewable energy infrastructure - including wind, solar, and geothermal - dams and RoR projects will be a component. The sooner we get developing this infrastructure - the longer our hydrocarbon supplies will last - and the slower the CO2 levels and temperatures will rise.

That is what these geeks in lab coats are recommending OBD - and have been for some time.

The response so far from the denier camp - It's all a mass hoax.

Speaking of geeks...Bill Gates.

Bill Gates is even more rich than the Koch idiots.

He - unlike the Koches - has a foundation http://www.gatesfoundation.org/ that funds communities with disease issues, fresh water issues, agriculture issues, education, etc. I think he will have quite a legacy when he dies.

The Koch's on the other hand - covertly fund a pile of right-wing think tanks that lie and cherry-pick data to confuse people so they can carry on business as usual. Quite a legacy alright. A completely different one than Gates. Not sure what they think their lives on this planet are all about.

You are quite welcome to blindly cut and paste their crap if you want to OBD - rather than reading the actual science and making your own mind up. Just keep in mind that what you are posting - is not Science.
 
Status
Not open for further replies.
Back
Top