http://www.sciencedaily.com/releases/2014/12/141215113949.htm
Past global warming similar to today's: Size, duration were like modern climate shift, but in two pulses
Date: December 15, 2014
Source: University of Utah
Summary: The rate at which carbon emissions warmed Earth’s climate almost 56 million years ago resembles modern, human-caused global warming much more than previously believed, but involved two pulses of carbon to the atmosphere, researchers have found.
Sediment cores that were drilled from Wyoming's Bighorn Basin and then sectioned for study are shown at a repository at the University of Bremen, Germany. A study of the cores led by University of Utah geochemist Gabe Bowen found that carbon emissions to the atmosphere during a global warming period almost 56 million years ago were more similar to today's human-caused climate change than previously was believed.
The rate at which carbon emissions warmed Earth's climate almost 56 million years ago resembles modern, human-caused global warming much more than previously believed, but involved two pulses of carbon to the atmosphere, University of Utah researchers and their colleagues found.
The findings mean the so-called Paleocene-Eocene thermal maximum, or PETM, can provide clues to the future of modern climate change. The good news: Earth and most species survived. The bad news: It took millennia to recover from the episode, when temperatures rose by 5 to 8 degrees Celsius (9 to 15 degrees Fahrenheit).
"There is a positive note in that the world persisted, it did not go down in flames, it has a way of self-correcting and righting itself," says University of Utah geochemist Gabe Bowen, lead author of the study published today in the journal Nature Geoscience. "However, in this event it took almost 200,000 years before things got back to normal."
Bowen and colleagues report that carbonate or limestone nodules in Wyoming sediment cores show the global warming episode 55.5 million to 55.3 million years ago involved the average annual release of a minimum of 0.9 petagrams (1.98 trillion pounds) of carbon to the atmosphere, and probably much more over shorter periods.
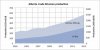
That is "within an order of magnitude of, and may have approached, the 9.5 petagrams [20.9 trillion pounds] per year associated with modern anthropogenic carbon emissions," the researchers wrote. Since 1900, human burning of fossil fuels emitted an average of 3 petagrams per year -- even closer to the rate 55.5 million years ago.
Each pulse of carbon emissions lasted no more than 1,500 years. Previous conflicting evidence indicated the carbon release lasted anywhere from less than a year to tens of thousands of years. The new research shows atmospheric carbon levels returned to normal within a few thousand years after the first pulse, probably as carbon dissolved in the ocean. It took up to 200,000 years for conditions to normalize after the second pulse.
The new study also ruled as unlikely some theorized causes of the warming episode, including an asteroid impact, slow melting of permafrost, burning of organic-rich soil or drying out of a major seaway. Instead, the findings suggest, in terms of timing, that more likely causes included melting of seafloor methane ices known as clathrates, or volcanism heating organic-rich rocks and releasing methane.
"The Paleocene-Eocene thermal maximum has stood out as a striking, but contested, example of how 21st-century-style atmospheric carbon dioxide buildup can affect climate, environments and ecosystems worldwide," says Bowen, an associate professor of geology and geophysics at the University of Utah.
"This new study tightens the link," he adds. "Carbon release back then looked a lot like human fossil-fuel emissions today, so we might learn a lot about the future from changes in climate, plants, and animal communities 55.5 million years ago."
Bowen cautioned, however, that global climate already was much warmer than today's when the Paleocene-Eocene warming began, and there were no icecaps, "so this played out on a different playing field than what we have today."
Study co-author Scott Wing, a paleobiologist at the Smithsonian Institution in Washington, adds: "This study gives us the best idea yet of how quickly this vast amount of carbon was released at the beginning of the global warming event we call the Paleocene-Eocene thermal maximum. The answer is just a few thousands of years or less. That's important because it means the ancient event happened at a rate more like human-caused global warming than we ever realized."
Bowen and Wing conducted the study with University of Utah geology and geophysics master's graduate Bianca Maibauer and technician Amy Steimke; Mary Kraus of University of Colorado, Boulder; Ursula Rohl and Thomas Westerhold of the University of Bremen, Germany; Philip Gingerich of the University of Michigan; and William Clyde of the University of New Hampshire. The study was funded by the National Science Foundation and the German Research Foundation
Effects of the Paleocene-Eocene Warming
Bowen says previous research has shown that during the Paleocene-Eocene warm period, there was "enhanced storminess in some areas, increased aridity in other places. We see continent-scale migration of animals and plants, ranges are shifting. We see only a little bit of extinction -- some groups of deep-sea foraminifera, one-cell organisms that go extinct at the start of this event. Not much else went extinct."
"We see the first wave of modern mammals showing up," including ancestral primates and hoofed animals," he adds. Oceans became more acidic, as they are now.
"We look through time recorded in those rocks, and this warming event stands out, and everything happens together," Bowen says. "We can look back in Earth's history and say this is how this world works, and it's totally consistent with the expectation that carbon dioxide change today will be associated with these other sorts of change."
The Paleocene-Eocene thermal maximum also points to the possibility of runaway climate change enhanced by feedbacks. "The fact we have two releases may suggest that second one was driven by the first," perhaps, for example, if the first warming raised sea temperatures enough to melt massive amounts of frozen methane, Bowen says.
Drilling into Earth's Past
The new study is part of a major drilling project to understand the 56-milion-year-old warming episode, which Bowen says first was discovered in 1991. The researchers drilled long, core-shaped sediment samples from two boreholes at Polecat Bench in northern Wyoming's Bighorn Basin, east of Cody and just north of Powell.
"This site has been excavated for well over 100 years by paleontologists studying fossil mammals," Bowen says. "It documents that transition from the early mammals we see after the extinction of the dinosaurs to Eocene mammals, which are in groups that are familiar today. There is a great stratigraphic sequence of more than 2 kilometers (1.2 miles) of rocks, from 65 million years ago to 52 million years ago."
The Paleocene-Eocene warming is recorded in the banded, flood-deposit tan and rusted red rock and soil layers of the Willwood formation, specifically within round, gray to brown-gray carbonate nodules in those rocks. They are 2 inches to 0.1 inches diameter.
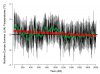
By measuring carbon isotope ratios in the nodules, the researchers found that during each 1,500-year carbon release, the ratio of carbon-13 to carbon-12 in the atmosphere declined, indicating two large releases of carbon dioxide or methane, both greenhouse gases from plant material. The decline was three parts per thousand for the first pulse, and 5.7 parts per thousand for the second.
Previous evidence from seafloor sediments elsewhere is consistent with two Paleocene-Eocene carbon pulses, which "means we don't think this is something is unique to northern Wyoming," Bowen says. "We think it reflects a global signal."
What Caused the Prehistoric Warming?
The double-barreled carbon release at the Paleocene-Eocene time boundary pretty much rules out an asteroid or comet impact because such a catastrophe would have been "too quick" to explain the 1,500-year duration of each carbon pulse, Bowen says.
Another theory: oxidation of organic matter -- as permafrost thawed, as peaty soils burned or as a seaway dried up -- may have caused the Paleocene-Eocene warming. But that would have taken tens of thousands of years, far slower than what the study found, he adds. Volcanoes releasing carbon gases also would have been too slow.
Bowen says the two relatively rapid carbon releases (about 1,500 years each) are more consistent with warming oceans or an undersea landslide triggering the melting of frozen methane on the seafloor and large emissions to the atmosphere, where it became carbon dioxide within decades. Another possibility is a massive intrusion of molten rock that heated overlying organic-rich rocks and released a lot of methane, he says.
Story Source: The above story is based on materials provided by University of Utah. Note: Materials may be edited for content and length.
Journal Reference: Gabriel J. Bowen, Bianca J. Maibauer, Mary J. Kraus, Ursula Röhl, Thomas Westerhold, Amy Steimke, Philip D. Gingerich, Scott L. Wing, William C. Clyde. Two massive, rapid releases of carbon during the onset of the Palaeocene–Eocene thermal maximum. Nature Geoscience, 2014; DOI: 10.1038/ngeo2316 http://dx.doi.org/10.1038/ngeo2316
Past global warming similar to today's: Size, duration were like modern climate shift, but in two pulses
Date: December 15, 2014
Source: University of Utah
Summary: The rate at which carbon emissions warmed Earth’s climate almost 56 million years ago resembles modern, human-caused global warming much more than previously believed, but involved two pulses of carbon to the atmosphere, researchers have found.
Sediment cores that were drilled from Wyoming's Bighorn Basin and then sectioned for study are shown at a repository at the University of Bremen, Germany. A study of the cores led by University of Utah geochemist Gabe Bowen found that carbon emissions to the atmosphere during a global warming period almost 56 million years ago were more similar to today's human-caused climate change than previously was believed.
The rate at which carbon emissions warmed Earth's climate almost 56 million years ago resembles modern, human-caused global warming much more than previously believed, but involved two pulses of carbon to the atmosphere, University of Utah researchers and their colleagues found.
The findings mean the so-called Paleocene-Eocene thermal maximum, or PETM, can provide clues to the future of modern climate change. The good news: Earth and most species survived. The bad news: It took millennia to recover from the episode, when temperatures rose by 5 to 8 degrees Celsius (9 to 15 degrees Fahrenheit).
"There is a positive note in that the world persisted, it did not go down in flames, it has a way of self-correcting and righting itself," says University of Utah geochemist Gabe Bowen, lead author of the study published today in the journal Nature Geoscience. "However, in this event it took almost 200,000 years before things got back to normal."
Bowen and colleagues report that carbonate or limestone nodules in Wyoming sediment cores show the global warming episode 55.5 million to 55.3 million years ago involved the average annual release of a minimum of 0.9 petagrams (1.98 trillion pounds) of carbon to the atmosphere, and probably much more over shorter periods.
That is "within an order of magnitude of, and may have approached, the 9.5 petagrams [20.9 trillion pounds] per year associated with modern anthropogenic carbon emissions," the researchers wrote. Since 1900, human burning of fossil fuels emitted an average of 3 petagrams per year -- even closer to the rate 55.5 million years ago.
Each pulse of carbon emissions lasted no more than 1,500 years. Previous conflicting evidence indicated the carbon release lasted anywhere from less than a year to tens of thousands of years. The new research shows atmospheric carbon levels returned to normal within a few thousand years after the first pulse, probably as carbon dissolved in the ocean. It took up to 200,000 years for conditions to normalize after the second pulse.
The new study also ruled as unlikely some theorized causes of the warming episode, including an asteroid impact, slow melting of permafrost, burning of organic-rich soil or drying out of a major seaway. Instead, the findings suggest, in terms of timing, that more likely causes included melting of seafloor methane ices known as clathrates, or volcanism heating organic-rich rocks and releasing methane.
"The Paleocene-Eocene thermal maximum has stood out as a striking, but contested, example of how 21st-century-style atmospheric carbon dioxide buildup can affect climate, environments and ecosystems worldwide," says Bowen, an associate professor of geology and geophysics at the University of Utah.
"This new study tightens the link," he adds. "Carbon release back then looked a lot like human fossil-fuel emissions today, so we might learn a lot about the future from changes in climate, plants, and animal communities 55.5 million years ago."
Bowen cautioned, however, that global climate already was much warmer than today's when the Paleocene-Eocene warming began, and there were no icecaps, "so this played out on a different playing field than what we have today."
Study co-author Scott Wing, a paleobiologist at the Smithsonian Institution in Washington, adds: "This study gives us the best idea yet of how quickly this vast amount of carbon was released at the beginning of the global warming event we call the Paleocene-Eocene thermal maximum. The answer is just a few thousands of years or less. That's important because it means the ancient event happened at a rate more like human-caused global warming than we ever realized."
Bowen and Wing conducted the study with University of Utah geology and geophysics master's graduate Bianca Maibauer and technician Amy Steimke; Mary Kraus of University of Colorado, Boulder; Ursula Rohl and Thomas Westerhold of the University of Bremen, Germany; Philip Gingerich of the University of Michigan; and William Clyde of the University of New Hampshire. The study was funded by the National Science Foundation and the German Research Foundation
Effects of the Paleocene-Eocene Warming
Bowen says previous research has shown that during the Paleocene-Eocene warm period, there was "enhanced storminess in some areas, increased aridity in other places. We see continent-scale migration of animals and plants, ranges are shifting. We see only a little bit of extinction -- some groups of deep-sea foraminifera, one-cell organisms that go extinct at the start of this event. Not much else went extinct."
"We see the first wave of modern mammals showing up," including ancestral primates and hoofed animals," he adds. Oceans became more acidic, as they are now.
"We look through time recorded in those rocks, and this warming event stands out, and everything happens together," Bowen says. "We can look back in Earth's history and say this is how this world works, and it's totally consistent with the expectation that carbon dioxide change today will be associated with these other sorts of change."
The Paleocene-Eocene thermal maximum also points to the possibility of runaway climate change enhanced by feedbacks. "The fact we have two releases may suggest that second one was driven by the first," perhaps, for example, if the first warming raised sea temperatures enough to melt massive amounts of frozen methane, Bowen says.
Drilling into Earth's Past
The new study is part of a major drilling project to understand the 56-milion-year-old warming episode, which Bowen says first was discovered in 1991. The researchers drilled long, core-shaped sediment samples from two boreholes at Polecat Bench in northern Wyoming's Bighorn Basin, east of Cody and just north of Powell.
"This site has been excavated for well over 100 years by paleontologists studying fossil mammals," Bowen says. "It documents that transition from the early mammals we see after the extinction of the dinosaurs to Eocene mammals, which are in groups that are familiar today. There is a great stratigraphic sequence of more than 2 kilometers (1.2 miles) of rocks, from 65 million years ago to 52 million years ago."
The Paleocene-Eocene warming is recorded in the banded, flood-deposit tan and rusted red rock and soil layers of the Willwood formation, specifically within round, gray to brown-gray carbonate nodules in those rocks. They are 2 inches to 0.1 inches diameter.
By measuring carbon isotope ratios in the nodules, the researchers found that during each 1,500-year carbon release, the ratio of carbon-13 to carbon-12 in the atmosphere declined, indicating two large releases of carbon dioxide or methane, both greenhouse gases from plant material. The decline was three parts per thousand for the first pulse, and 5.7 parts per thousand for the second.
Previous evidence from seafloor sediments elsewhere is consistent with two Paleocene-Eocene carbon pulses, which "means we don't think this is something is unique to northern Wyoming," Bowen says. "We think it reflects a global signal."
What Caused the Prehistoric Warming?
The double-barreled carbon release at the Paleocene-Eocene time boundary pretty much rules out an asteroid or comet impact because such a catastrophe would have been "too quick" to explain the 1,500-year duration of each carbon pulse, Bowen says.
Another theory: oxidation of organic matter -- as permafrost thawed, as peaty soils burned or as a seaway dried up -- may have caused the Paleocene-Eocene warming. But that would have taken tens of thousands of years, far slower than what the study found, he adds. Volcanoes releasing carbon gases also would have been too slow.
Bowen says the two relatively rapid carbon releases (about 1,500 years each) are more consistent with warming oceans or an undersea landslide triggering the melting of frozen methane on the seafloor and large emissions to the atmosphere, where it became carbon dioxide within decades. Another possibility is a massive intrusion of molten rock that heated overlying organic-rich rocks and released a lot of methane, he says.
Story Source: The above story is based on materials provided by University of Utah. Note: Materials may be edited for content and length.
Journal Reference: Gabriel J. Bowen, Bianca J. Maibauer, Mary J. Kraus, Ursula Röhl, Thomas Westerhold, Amy Steimke, Philip D. Gingerich, Scott L. Wing, William C. Clyde. Two massive, rapid releases of carbon during the onset of the Palaeocene–Eocene thermal maximum. Nature Geoscience, 2014; DOI: 10.1038/ngeo2316 http://dx.doi.org/10.1038/ngeo2316