Port Edward to receive $150 million from agreement
http://www.thenorthernview.com/news/285971451.html
http://www.thenorthernview.com/news/285971451.html
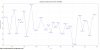
Global Sea Ice Extent Highest Since 1988.
[VNgqv4yVyDw]https://www.youtube.com/watch?v=VNgqv4yVyDw
Published on Apr 9, 2014
SOURCES:
1:48 "Recent Ice-Sheet Growth in the Interior of Greenland"
Ola M. Johannessen et al, Science November 2005
2:10 "Recent Greenland Ice Mass Loss by Drainage System from Satellite Gravity Observations" -- S. B. Luthcke, et al., Science November 2006
2:12 "Melting of Greenland Ice Sheet Satellite Gravity Measurements Confirm Accelerated Melting of Greenland Ice Sheet" --
J. L. Chen, et al., Science 2006
3:19 "Satellite gravity measurements confirm accelerated melting of Greenland ice sheet" J. Chen et al., Science, 2006
3:22 "Recent Greenland Ice Mass Loss by Drainage System from Satellite Gravity Observations" -- Luthcke et al, Science, 2006
3:24 "Lower estimates of Antarctic sea level contribution from satellite gravimetry" King et al, Nature 2012
3:26 Recent Antarctic ice mass loss from radar interferometry and regional climate modelling" -- Rignot et al, 2008
3:28 "Recent Contributions of glaciers and ice caps to sea level rise from GRACE"
3:30 "A Reconciled Estimate of Ice-Sheet Mass Balance"
Shepherd et al Science 2012
4:01 "Recent Contributions of glaciers and ice caps to sea level rise from GRACE"
4:24 "Toward prediction of environmental Arctic change"
W Maslowski, JC Kinney, J Jakacki - Computing in Science 2007
5:25 "Kinematic Constraints on Glacier Contributions to 21st-Century Sea-Level Rise" -- WT Pfeffer et al., Science 2008
5:40 "Global sea level linked to global temperature" --
Martin Vermeer and Stefan Rahmstorf, PNAS 2009
6:10 Table adapted from "Ranking Port Cities with High Exposure and Vulnerability to Climate Extremes"
-- R. J. Nicholls et al., OECD 2008
8:02 "Kinematic Constraints on Glacier Contributions to 21st-Century Sea-Level Rise" -- WT Pfeffer et al., Science 2008
8:57 "Climate: Observations, projections and Impacts" -- Met Office 2013.
http://www.metoffice.gov.uk/climate-g...
10:05 "Precipitation and its extremes in changed climates"
-- T. Schneider and P. A. O'Gorman, Journal of Climate 2008
11:30 "Effects of climate change on global food production under SRES emissions and socio-economic scenarios" -- Parry et al, Global Environmental Change 2004
11:52 "Threats to Water Supplies in the Tropical Andes" Bradley et al., Science 2006
11:55 "Evidence for Upwelling of Corrosive "Acidified" Water onto the Continental Shelf" -- Richard A. Feely, Science 2008
12:01 "Coral Reefs: Present Problems and Future Concerns Resulting from Anthropogenic Disturbance" -- RH Richmond, American Zoologist 1993
12:06 "Global Warming and Coastal Erosion" -- Zhang et al., Climatic Change
12: 08 "Global response of terrestrial ecosystem structure and function to CO2 and climate change: results from six dynamic global vegetation models" -- Cramer et al., Global Change Biology 2001
12:25 "The Recent Increase in Atlantic Hurricane Activity: Causes and Implications" -- Goldenberg, Science 2001
12:34 "A link between reduced Barents-Kara sea ice and cold winter extremes over northern continents"
Petoukhov, V., and V. A. Semenov,
JOURNAL OF GEOPHYSICAL RESEARCH, Nov 2010
14:08 I backtracked this new "CAGW" label, and it seems to have started with author Michael Crichton in 2007, but was popularized in 2010 with an opinion piece in the Washington Post.
14:42 Table adapted from "Ranking Port Cities with High Exposure and Vulnerability to Climate Extremes"
-- R. J. Nicholls et al., OECD 2008
15:07 "Projected impacts of climate change on marine fish and fisheries"
Anne B. Hollowed
15:12 "Stern Review on the Economics of Climate Change" -- UK Government report, 2006
Well how about this then....LOL, i see you cannot get anything new?
April, really. It is December now.
I see you can't tell ******** when you see it.... So the "Rift ate my Ice" even if it is 4000 meters below that same ice.... This is typical of your team of deniers. You make no sense when you and your arguments are give even the slightest bit of scrutiny.Update On Geothermal Heat And Arctic Ocean Sea Ice Melt
mid-arctic rift
This article was UPDATED on Dec 17, 2014 with new information on the Arctic's rift system and its likely affects on sea ice:
The floor of the Arctic Ocean is comprised of several significant geological features, most notably the giant Mid-Arctic Rift and associated Rift System. The system is 1100 miles long / 120 miles wide and topographically expressed as high mountains and Grand Canyon scale trenches.


That's not what the article said. Here I will quote it for you again....In the Arctic, nearby soot may be a larger forcing than CO2
Why is it that you and your denial team continue to misrepresent the science. Did you think we would not see that.Black carbon, also known as soot, emitted from combustion of fuels and biomass burning, absorbs solar radiation in the atmosphere and is one of the major causes of global warming, after carbon dioxide emissions.