
You are using an out of date browser. It may not display this or other websites correctly.
You should upgrade or use an alternative browser.
You should upgrade or use an alternative browser.
Climate: LNG in B.C. vs Alberta tarsands
- Thread starter Foxsea
- Start date
- Status
- Not open for further replies.
GLG
Well-Known Member
Drowning In An Ocean Of Misinformation?
Why don't you read the study?
Or do you just like to read the misinformation......
http://bioscience.oxfordjournals.or...full?sid=a1828fc1-3d6b-41a3-97b8-8bcc6372631c
OldBlackDog
Well-Known Member
T]here have been a few claims for already realized impacts of ocean acidification on calcifiers, such as a decline in the number of oysters on the West Coast of North America (Barton et al. 2012) and in Chesapeake Bay (Waldbusser et al. 2011). However, the link between these declines and ocean acidification through anthropogenic CO2 is unclear. Corrosive waters affecting oysters in hatcheries along the Oregon coast were associated with upwelling (Barton et al. 2012), not anthropogenic CO2. The decline in pH affecting oysters in Chesapeake Bay (Waldbusser et al. 2011) was not attributable to anthropogenic CO2 but was likely attributable to excess respiration associated with eutrophication. Therefore, there is, as yet, no robust evidence for realized severe disruptions of marine socioecological links from ocean acidification to anthropogenic CO2, and there are significant uncertainties regarding the level of pH change that would prompt such impacts.
OldBlackDog
Well-Known Member
From your site.
However, there have been a few claims for already realized impacts of ocean acidification on calcifiers, such as a decline in the number of oysters on the West Coast of North America (Barton et al. 2012) and in Chesapeake Bay (Waldbusser et al. 2011). However, the link between these declines and ocean acidification through anthropogenic CO2 is unclear. Corrosive waters affecting oysters in hatcheries along the Oregon coast were associated with upwelling (Barton et al. 2012), not anthropogenic CO2. The decline in pH affecting oysters in Chesapeake Bay (Waldbusser et al. 2011) was not attributable to anthropogenic CO2 but was likely attributable to excess respiration associated with eutrophication. Therefore, there is, as yet, no robust evidence for realized severe disruptions of marine socioecological links from ocean acidification to anthropogenic CO2, and there are significant uncertainties regarding the level of pH change that would prompt such impacts.
However, there have been a few claims for already realized impacts of ocean acidification on calcifiers, such as a decline in the number of oysters on the West Coast of North America (Barton et al. 2012) and in Chesapeake Bay (Waldbusser et al. 2011). However, the link between these declines and ocean acidification through anthropogenic CO2 is unclear. Corrosive waters affecting oysters in hatcheries along the Oregon coast were associated with upwelling (Barton et al. 2012), not anthropogenic CO2. The decline in pH affecting oysters in Chesapeake Bay (Waldbusser et al. 2011) was not attributable to anthropogenic CO2 but was likely attributable to excess respiration associated with eutrophication. Therefore, there is, as yet, no robust evidence for realized severe disruptions of marine socioecological links from ocean acidification to anthropogenic CO2, and there are significant uncertainties regarding the level of pH change that would prompt such impacts.
GLG
Well-Known Member
Bad News For Warmists: Sun Has Entered 'Weakest Solar Cycle In A Century'
The conceit that human production of carbon dioxide is capable of driving the earth’s climate is running smack into the sun. CO2 accounts for a mere 0.039% of the atmosphere, while the sun accounts for 99.86% of all of the mass in our entire solar system. And Ol’ Sol is not taking the insult lightly. Vencore Weather reports:
For the past 5 days, solar activity has been very low and one measure of solar activity – its X-ray output – has basically flatlined in recent days (plot below courtesy NOAA/Space Weather Prediction Center). Not since cycle 14 peaked in February 1906 has there been a solar cycle with fewer sunspots.
…if history is a guide, it is safe to say that weak solar activity for a prolonged period of time can have a negative impact on global temperatures in the troposphere which is the bottom-most layer of Earth’s atmosphere - and where we all live. There have been two notable historical periods with decades-long episodes of low solar activity. The first period is known as the “Maunder Minimum”, named after the solar astronomer Edward Maunder, and it lasted from around 1645 to 1715. The second one is referred to as the “Dalton Minimum”, named for the English meteorologist John Dalton, and it lasted from about 1790 to 1830. Both of these historical periods coincided with below-normal global temperatures in an era now referred to by many as the “Little Ice Age”. In addition, research studies in just the past couple of decades have found a complicated relationship between solar activity, cosmic rays, and clouds on Earth. This research suggests that in times of low solar activity where solar winds are typically weak; more cosmic rays reach the Earth’s atmosphere which, in turn, has been found to lead to an increase in certain types of clouds that can act to cool the Earth.
It is common sense to believe that the sun has more influence on global temperatures than a trace gas. With a 17 year “pause” in the predicted outcomes of an increase in atmospheric CO2, warmists face more and more awkward questions. If temperatures actually decline as a result of an expected decrease in solar activity, at some point the game will be up, and the billions of dollars a year squandered on climate modeling that doesn’t predict what happens will have to dry up.
Source
Well I guess team fence posts are calling for Little Ice Age version 2, after all CO2 does nothing except plant food right.....
Climate change deniers have a long history of calling for new ice ages so what should we expect.
Uploaded on Feb 3, 2009 A favorite hobby horse of Climate Denialists is that there is some kind of invisible, undetectable influence from the sun that is responsible for the unequivocal warming of the last century. Let's put that crock under a microscope and see where the cracks are.
[_Sf_UIQYc20]https://www.youtube.com/watch?v=_Sf_UIQYc20#t=146
OldBlackDog
Well-Known Member
Can we stop the doom mongering?
A letter to the editor which appeared in the Norman, OK Transcript on Tuesday, February 17th, reprinted here with permission of the author, Dr. David Deming:
I write in rebuttal to the Feb. 12 letter by Nancy Smart advising us to “listen” to climate scientists. According to Ms. Smart, climate science is “settled.” Instead of thinking for ourselves, she recommends we obsequiously follow the dictates of “our most respected and highest level scientific agencies.”
Whenever someone asserts that a scientific question is “settled,” they tell me immediately that they don’t understand the first thing about science. Science is never settled. Science is not a dogmatic body of doctrine. It is an open system of knowledge that establishes probable truths that are subject to continual revision. The entire history of science is one of established theories being overthrown. Astronomers once believed the Sun revolved around the Earth. Naturalists maintained that species were immutable. Geologists thought continental drift was physically impossible. Physicians attempted to cure people by blood-letting. Are we to suppose that the process of history has stopped?
Ms. Smart claims that 2014 was the warmest year on record. But there is no such thing as a measured temperature for the entire Earth. Estimates of climate change are not data, but interpretations produced by manipulating data of dubious quality. Anthony Watts’ survey of meteorological stations in the US has shown that more than 90 percent of temperature sensors may have systematic errors larger than 1 degree Celsius. Watts and his colleagues have found thermometers sitting in asphalt parking lots next to air conditioner vents blowing out hot air. To verify their claim of the “hottest year on record,” climate researchers must reconstruct the temperature record of the entire planet since the year 1880. Pray tell. If our current system of temperature measurement in the United States is unreliable, how can you expect us to believe that you can accurately estimate what the temperature of the South Pacific Ocean was in the year 1890?
We are told that there is an increase in the “number and frequency” of “extreme weather events.” Ms. Smart is long on vague generalities but short on specifics. If the weather is deteriorating so badly, its strange that she can’t list even one of these alleged weather events. In fact, weather is not climate and the climate is not changing. Global hurricane and cyclone activity is near a forty-three-year low. There has been no increase in tornadoes in the US. Neither droughts nor wildfires have increased. The poles are not melting. There has been no significant change in the global extent of sea ice since satellite monitoring began in 1979.
Scientific hypotheses are not proved; they are corroborated or falsified. But global warming is the hypothesis that can never be falsified. Several years ago, we were told that global warming meant the end of snow in winter. Then the east coast of the US suffered devastating blizzards in 2010 (“Snowmageddon“). A few days later the party line was retroactively modified with the preposterous claim that global warming would produce less snow but more blizzards. Hot weather, cold weather, it makes no difference. Every weather event is portrayed as being consistent with global warming. That’s because global warming is not a scientific hypothesis, but a dogmatic ideology. It resembles nothing so much as Bible-based creation science.
Ms. Smart proposes a “solution” to global warming entailing something she describes as a “carbon fee and dividend program.” She claims this is a “market-based approach” that will “help the economy and create jobs.” Nonsense. If it were “market-based” it would not have to be imposed coercively through government. Spending, labeled “investment,” in failed “green energy” programs and companies over the last few years has been an utter debacle. Over $500. million was lost on Solyndra alone. The reason these programs don’t work is that you can’t change the laws of physics and chemistry through wishful thinking and political action. Reality imposes constraints even on people who are detached from it.
Neither is the “solution” a solution. You don’t have to be a climate scientist to understand arithmetic. The per capita annual carbon generated in the US from using fossil fuels is about 4.4 tons. Norman’s population is 120,000. So if carbon emissions for the entire city went to zero, we would prevent 528,000 tons of carbon from entering the atmosphere each year. That sounds like an impressive number, but its only 0.000528 gigatons (GT). The Earth’s atmosphere contains 720 GT of carbon. The oceans contain 38,400 GT. Every year, the atmosphere and oceans exchange about 90 GT of carbon. Nothing the city of Norman does is going to measurably change the composition of Earth’s atmosphere, and any claim to the contrary is utterly irrational.
Carbon dioxide is not a pollutant, and the Earth’s climate is not changing. So please, give it a rest. We’re tired of the array of tendentious claims and the endless litany of hysterical doom-mongering.
David Deming
Norman, Oklahoma
email: ddeming@ou.edu
OldBlackDog
Well-Known Member
Record Keepers Cooked Global Temp Books
Remember the horror stories about 2014 being the hottest year since before Henry Ford took his date to the prom in a hay-fueled buggy?
The terrors posed by melting glaciers and rising sea levels threatening polar bears and Al Gore’s new coastal California residence? And oh yeah, mustn’t forget those historic first-time-ever droughts and tag team hurricanes — all caused, of course, by our CO2-belching smoke stacks and SUVs?
Well, maybe not. It seems that official surface temperature records upon which this panic has rested have been systematically cooked to indicate that Earth has recently been overheating just as alarmists, including some at NASA, wish us to believe. This will come as no surprise, however, to scientists familiar with data recorded from satellite and high altitude balloon instruments. That data shows that global mean temperatures have been statistically flat over the past 18 years.
Pseudoscientific chicanery reported last year by Steven Goddard’s Real Science blog illustrates shameless manipulation of some of the world’s most influential climate records.
His investigation reveals that many surface measurements originally recorded in NOAA’s U.S. Historical Climatology Network (USHCN) have been replaced with temperatures “fabricated” from theoretical computer models.
In doing so, original recorded temperatures were subsequently lowered, thereby exaggerating warming in recent decades by comparison. Whereas the original records show that the U.S. has actually been cooling since the 1930s, the hottest decade on record, NOAA’s manipulated graph based nearly half on fantasy data projects a high warming rate in excess of 3 degrees Celsius per century.
NASA’s Goddard Institute for Space Studies based its recent mainstream media-parroted “2014 hottest year” canard on this same contrived data, but ratcheted up the hot spin cycle even more.
Yet when the Daily Mail asked the new NASA-GISS Director Gavin Schmidt why the press release failed to mention his own low confidence that the likelihood of 2014 being “the warmest year since 1880” is just 38 percent, he offered no response.
Incidentally, that alleged “record” amounted to a two-hundredths of a degree increase over 2010, the previously claimed “warmest year.” That miniscule difference falls within a margin of error broadly recognized to be several times higher.
More evidence of this feverish fraud was reported earlier this month by English journalist Christopher Booker in The Telegraph. Booker’s U.K. article discussed an investigation into “how we are being tricked by flawed data on global warming,” which was conducted by Paul Homewood who checked original temperature graphs for weather stations in Paraguay against subsequent substitutions.
Booker noted that “the actual trend over 60 years of data had been dramatically reversed, so that a cooling trend was changed to one showing a marked warming.”
Homewood then checked a swath of other South American weather stations around the original three, finding the same one-way “adjustments” in all of them.
The first of these again appeared in NOAA’s USHCN. These in turn, were then amplified by NASA-GISS and NOAA’s National Climate Data Center using hypothetical warming trends to estimate temperatures across vast regions of the planet where no measurements exist.
Yet, as Booker emphasizes, “these are the very records on which scientists and politicians rely for their belief in ‘global warming’.”
Homewood is now finding evidence of the same pattern of data fudging for weather stations across much of the Arctic between Canada and the heart of Siberia. In nearly every case the one-way tweaks show warming up to one degree C higher than actual original data indicates. Replaced versions also completely eliminate obvious evidence of Iceland’s “sea ice years” around 1970 when extreme cooling nearly devastated the country’s economy.
Homewood points out that even a 1987 NASA-GISS graph presented in a paper authored by its former director and lead climate alarmist James Hansen was doctored to “transform Arctic history.”
This falsification was first exposed in 2007 by Canadian statistician Steve McIntyre. Here, the original Arctic temperatures which were actually much higher than any time since had been lowered so much that they became dwarfed by those of the past 20 years.
Those who worry a lot about the vanishing Arctic ice caps and drowning polar bears we keep hearing about in order to sell the Obama administration’s EPA war on coal should be cheered to know that Arctic temperature shifts have virtually nothing at all to do with atmospheric CO2 concentrations. In reality they are caused by perfectly natural multi-decadal changes in Atlantic Ocean currents.
So now that the Atlantic is about to flip back to a cyclical cooling phase, perhaps we should begin to worry more about how to heat our homes with windmills and sunbeams. In any case, will someone please kindly inform Al Gore and those frantic polar bears they can finally relax?
Larry Bell is an endowed professor of space architecture at the University of Houston where he founded the Sasakawa International Center for Space Architecture (SICSA) and the graduate program in space architecture. He is author of “Climate of Corruption: Politics and Power Behind the Global Warming Hoax,” and his professional aerospace work has been featured on the History Channel and the Discovery Channel-Canada. Read more of his reports — Click Here Now.
© 2015 Newsmax. All rights reserved.
OldBlackDog
Well-Known Member
Give it a rest OBD your looking oh so silly with your cut and pastes.
Your theory's are a coffin with so many nails in it already that the hard part is finding a place to hammer in a new one.
LOL. You are so scientific.
Attachments

GLG
Well-Known Member
One of OBD's cut and paste arguments always seem to tell us how fossil fuels are the answer to bring poor countries people out of poverty. Their answer is to sell them kerosene to light up the darkness and transform there way of life. Well there is a better way.
[ivztDi3EH-Q]https://www.youtube.com/watch?v=ivztDi3EH-Q&index=8&list=UUL4ShU6B2K1jc21dHYptCwA
cue the coffin.....
[ivztDi3EH-Q]https://www.youtube.com/watch?v=ivztDi3EH-Q&index=8&list=UUL4ShU6B2K1jc21dHYptCwA
cue the coffin.....
Last edited by a moderator:
OldBlackDog
Well-Known Member
Reality.
BP 2035 Outlook Foresees Only 8% Renewable Energy By 2035! No End In Sight For Fossil Fuel Growth!
Browse: Home / 2015 / February / 18 / BP 2035 Outlook Foresees Only 8% Renewable Energy By 2035! No End In Sight For Fossil Fuel Growth!
One of the biggest miscalculations that the global warming alarmists have made is claiming that global CO2 emissions must reach their peak by 2020 and then begin falling rapidly. If they don’t, there will be no chance of reaching the 2°C maximum warming target. Planetary catastrophe will ensue, the alarmists claim.
British energy behemoth BP has just released its BP Energy Outlook 2035, and it states in no uncertain terms that there is no chance of CO2 emissions beginning their decline by 2035, let alone 2020!
Good news: global GDP to double!
The BP reports states, “By 2035, the world’s population is projected to reach 8.7 billion, which means an additional 1.6 billion people will need energy.” and the globe’s “GDP is expected to more than double“.
That’s good news for humanity. More people enjoying the one-time gift of life and doing so in greater comfort. But that’s going to require energy, of course.
India 3rd largest economy in 2035
The BP report projects that India will go from being a third world country to being the world’s third largest economy.
That has major implications for the world’s energy market. The BP writes (my emphasis):
Primary energy consumption increases by 37% between 2013 and 2035, with growth averaging 1.4% p.a.. Virtually all (96%) of the projected growth is in the non-OECD, with energy consumption growing at 2.2% p.a.. OECD energy consumption, by contrast, grows at just 0.1% p.a. over the whole period and is actually falling from 2030.”
That’s strong growth, and today’s renewable energy technology will have no chance of economically meeting that kind of demand. Wind and solar are just too unreliable, and their storage is still a long way from being feasible. This is glaringly obvious in the BP report.
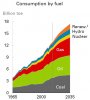
No end in sight for fossil fuel growth
The BP report features the following chart showing the breakdown of primary fuel consumption by 2035.
BP_2035 Energy
Source: BP.
The above figure foresees massive expansion of the traditional carbon based fossil fuels, especially oil and gas, with modest growth in coal consumption. That means global CO2 emissions will continue growing strongly, which would mean bad news if the CO2 greenhouse theory were correct. But so far, despite the massive rise in global CO2 emissions since the year 2000, global temperatures have not risen at all, and global warming scientists are now under extreme pressure to revise downwards their once lofty warming projections.
Emissions well above path recommended by scientists!
The future development of CO2 emissions bodes extremely ill for global warming alarmists. The BP Report writes on page 85: “Global CO2 emissions from energy use grow by 25% (1% p.a.) over the Outlook. Emissions remain well above the path recommended by scientists, illustrated by the IEA’s “450 Scenario”. In 2035, CO2 emissions are 18 billion tonnes above the IEA’s 450 Scenario.”
CO2 theory rapidly approaching its Waterloo
CO2 emissions growth clearly is not going to be curbed anytime soon, and temperatures really will have to start climbing in earnest if the AGW theory is to survive. (Un)fortunately there are no signs that is going to happen in the next 10-20 years.
Only 8% renewable energy by 2035
Page 14 of the BP Report shows strong growth in renewable energy, but it will be only about 8% of global energy supply. That’s light year’s away from the UN’s 50% target! Obviously, no one except a few token countries are taking renewable energies seriously. Their impracticality is their major obstacle.
On page 17 the BP states that “coal remains the dominant fuel, accounting for more than a third of the inputs to power generation.”
Planet awash in energy
The report shows a planet that is awash in energy and also projects strong growth in “new energy forms” such as shale and oil sands (p. 20) which “are thought to be abundant”. On page 95 the report states (my emphasis):
North America’s oil and natural gas supply outlook has been revised higher yet again (14%) due to the continued evolving expectations for shale gas and tight oil.”
The BP report summarizes on page 97:
Our Outlook shows more growth in non-OECD energy demand than the IEA NP; it also shows more growth for fossil fuels, especially for coal. This probably reflects differing views on the outlook for rapidly industrializing economies, in particular on the speed with which they can move to a less energy-intensive growth path.”
Read: BP Energy Outlook 2035.
BP 2035 Outlook Foresees Only 8% Renewable Energy By 2035! No End In Sight For Fossil Fuel Growth!
Browse: Home / 2015 / February / 18 / BP 2035 Outlook Foresees Only 8% Renewable Energy By 2035! No End In Sight For Fossil Fuel Growth!
One of the biggest miscalculations that the global warming alarmists have made is claiming that global CO2 emissions must reach their peak by 2020 and then begin falling rapidly. If they don’t, there will be no chance of reaching the 2°C maximum warming target. Planetary catastrophe will ensue, the alarmists claim.
British energy behemoth BP has just released its BP Energy Outlook 2035, and it states in no uncertain terms that there is no chance of CO2 emissions beginning their decline by 2035, let alone 2020!
Good news: global GDP to double!
The BP reports states, “By 2035, the world’s population is projected to reach 8.7 billion, which means an additional 1.6 billion people will need energy.” and the globe’s “GDP is expected to more than double“.
That’s good news for humanity. More people enjoying the one-time gift of life and doing so in greater comfort. But that’s going to require energy, of course.
India 3rd largest economy in 2035
The BP report projects that India will go from being a third world country to being the world’s third largest economy.
That has major implications for the world’s energy market. The BP writes (my emphasis):
Primary energy consumption increases by 37% between 2013 and 2035, with growth averaging 1.4% p.a.. Virtually all (96%) of the projected growth is in the non-OECD, with energy consumption growing at 2.2% p.a.. OECD energy consumption, by contrast, grows at just 0.1% p.a. over the whole period and is actually falling from 2030.”
That’s strong growth, and today’s renewable energy technology will have no chance of economically meeting that kind of demand. Wind and solar are just too unreliable, and their storage is still a long way from being feasible. This is glaringly obvious in the BP report.
No end in sight for fossil fuel growth
The BP report features the following chart showing the breakdown of primary fuel consumption by 2035.
BP_2035 Energy
Source: BP.
The above figure foresees massive expansion of the traditional carbon based fossil fuels, especially oil and gas, with modest growth in coal consumption. That means global CO2 emissions will continue growing strongly, which would mean bad news if the CO2 greenhouse theory were correct. But so far, despite the massive rise in global CO2 emissions since the year 2000, global temperatures have not risen at all, and global warming scientists are now under extreme pressure to revise downwards their once lofty warming projections.
Emissions well above path recommended by scientists!
The future development of CO2 emissions bodes extremely ill for global warming alarmists. The BP Report writes on page 85: “Global CO2 emissions from energy use grow by 25% (1% p.a.) over the Outlook. Emissions remain well above the path recommended by scientists, illustrated by the IEA’s “450 Scenario”. In 2035, CO2 emissions are 18 billion tonnes above the IEA’s 450 Scenario.”
CO2 theory rapidly approaching its Waterloo
CO2 emissions growth clearly is not going to be curbed anytime soon, and temperatures really will have to start climbing in earnest if the AGW theory is to survive. (Un)fortunately there are no signs that is going to happen in the next 10-20 years.
Only 8% renewable energy by 2035
Page 14 of the BP Report shows strong growth in renewable energy, but it will be only about 8% of global energy supply. That’s light year’s away from the UN’s 50% target! Obviously, no one except a few token countries are taking renewable energies seriously. Their impracticality is their major obstacle.
On page 17 the BP states that “coal remains the dominant fuel, accounting for more than a third of the inputs to power generation.”
Planet awash in energy
The report shows a planet that is awash in energy and also projects strong growth in “new energy forms” such as shale and oil sands (p. 20) which “are thought to be abundant”. On page 95 the report states (my emphasis):
North America’s oil and natural gas supply outlook has been revised higher yet again (14%) due to the continued evolving expectations for shale gas and tight oil.”
The BP report summarizes on page 97:
Our Outlook shows more growth in non-OECD energy demand than the IEA NP; it also shows more growth for fossil fuels, especially for coal. This probably reflects differing views on the outlook for rapidly industrializing economies, in particular on the speed with which they can move to a less energy-intensive growth path.”
Read: BP Energy Outlook 2035.
Attachments
OldBlackDog
Well-Known Member
Report: Solar Energy Subsidies Cost $39 Billion Per Year
An auction sign outside the headquarters of Solyndra, which declared bankruptcy in 2011. / AP
An auction sign outside the headquarters of Solyndra, which declared bankruptcy in 2011. / AP
BY: Elizabeth Harrington
February 12, 2015 12:55 pm
Despite billions spent in investments over decades, solar energy will only make up 0.6 percent of total electricity generation in the United States, according to a report released by the Taxpayers Protection Alliance (TPA).
“In spite of government’s best efforts to encourage innovation by solar energy companies and encourage Americans to rely more heavily on solar electricity, solar power continues to be a losing proposition,” the report said. “American taxpayers spent an average of $39 billion a year over the past 5 years financing grants, subsidizing tax credits, guaranteeing loans, bailing out failed solar energy boondoggles and otherwise underwriting every idea under the sun to make solar energy cheaper and more popular. But none of it has worked.”
Government support for the solar industry is vast, with at least 345 different federal initiatives that spread across 20 agencies, the report noted. The Pentagon has the highest number of solar programs, with 63, followed by the Interior Department, which oversees 37 programs. The Energy Department only manages 34 solar programs.
“This report is only the first step in asking the important questions about solar subsidies,” said David Williams, the president of the TPA. “Taxpayers need to know the truth about where their dollars are being spent.”
“Congress needs to stop these massive subsidies that are siphoning $39 billion a year from taxpayers,” he said. “If solar is ever going to be a viable energy source and industry, they need to wean themselves off the public dole.”
In addition to the federal government, which has spent $150 billion in the last five years, states also heavily subsidize the industry by offering tax breaks and 538 rebate programs.
However, solar energy will only contribute 0.6 percent of total U.S. electricity generation in 2015, the TPA’s report said.
Last month the Energy Department announced an additional $59 million for “solar deployment plans.”
“The U.S. has installed more than 17 gigawatts of solar power—enough to power 3.5 million average American homes,” the agency noted. Seventeen gigawatts is only enough to power 3.02 percent of the 115. 6 million households in the United States.
A majority of federal spending for solar power goes towards tax incentives, grants, and loan guarantees, the report said, including the Investment Tax Credit, which was used by Solyndra, and the Sunshot Initiative.
The Sunshot Initiative spends $270 million per year attempting to “induce companies to lower production and installation costs associated with photovoltaic solar panel systems and reducing the price of solar power,” the report said.
The report concluded that the time has come for solar energy to prove its merits without billions in support from the federal government.
“After decades of massive ‘investments’ and disappointing results, it is time that Americans critically evaluate whether our faltering federal solar initiatives deserve continued support,” the report said. “With so little to show for so many costly initiatives, it should be apparent to objective observers that federal solar power efforts have not been a productive or prudent use of precious tax dollars.”
“Solar energy’s day in the sun may yet come, but taxpayers should not be forced to foot the cost associated with turning the failing industry around,” it added. “Solar energy must be asked to stand on its own, powered exclusively by private investment and initiative.”
An auction sign outside the headquarters of Solyndra, which declared bankruptcy in 2011. / AP
An auction sign outside the headquarters of Solyndra, which declared bankruptcy in 2011. / AP
BY: Elizabeth Harrington
February 12, 2015 12:55 pm
Despite billions spent in investments over decades, solar energy will only make up 0.6 percent of total electricity generation in the United States, according to a report released by the Taxpayers Protection Alliance (TPA).
“In spite of government’s best efforts to encourage innovation by solar energy companies and encourage Americans to rely more heavily on solar electricity, solar power continues to be a losing proposition,” the report said. “American taxpayers spent an average of $39 billion a year over the past 5 years financing grants, subsidizing tax credits, guaranteeing loans, bailing out failed solar energy boondoggles and otherwise underwriting every idea under the sun to make solar energy cheaper and more popular. But none of it has worked.”
Government support for the solar industry is vast, with at least 345 different federal initiatives that spread across 20 agencies, the report noted. The Pentagon has the highest number of solar programs, with 63, followed by the Interior Department, which oversees 37 programs. The Energy Department only manages 34 solar programs.
“This report is only the first step in asking the important questions about solar subsidies,” said David Williams, the president of the TPA. “Taxpayers need to know the truth about where their dollars are being spent.”
“Congress needs to stop these massive subsidies that are siphoning $39 billion a year from taxpayers,” he said. “If solar is ever going to be a viable energy source and industry, they need to wean themselves off the public dole.”
In addition to the federal government, which has spent $150 billion in the last five years, states also heavily subsidize the industry by offering tax breaks and 538 rebate programs.
However, solar energy will only contribute 0.6 percent of total U.S. electricity generation in 2015, the TPA’s report said.
Last month the Energy Department announced an additional $59 million for “solar deployment plans.”
“The U.S. has installed more than 17 gigawatts of solar power—enough to power 3.5 million average American homes,” the agency noted. Seventeen gigawatts is only enough to power 3.02 percent of the 115. 6 million households in the United States.
A majority of federal spending for solar power goes towards tax incentives, grants, and loan guarantees, the report said, including the Investment Tax Credit, which was used by Solyndra, and the Sunshot Initiative.
The Sunshot Initiative spends $270 million per year attempting to “induce companies to lower production and installation costs associated with photovoltaic solar panel systems and reducing the price of solar power,” the report said.
The report concluded that the time has come for solar energy to prove its merits without billions in support from the federal government.
“After decades of massive ‘investments’ and disappointing results, it is time that Americans critically evaluate whether our faltering federal solar initiatives deserve continued support,” the report said. “With so little to show for so many costly initiatives, it should be apparent to objective observers that federal solar power efforts have not been a productive or prudent use of precious tax dollars.”
“Solar energy’s day in the sun may yet come, but taxpayers should not be forced to foot the cost associated with turning the failing industry around,” it added. “Solar energy must be asked to stand on its own, powered exclusively by private investment and initiative.”
Attachments

GLG
Well-Known Member
Reality.
BP 2035 Outlook Foresees Only 8% Renewable Energy By 2035! No End In Sight For Fossil Fuel Growth!
Yup reality is a *****....
This presentation contains forward-looking statements, particularly those regarding global economic growth, population growth, energy consumption, policy support for renewable energies and sources of energy supply. Forward-looking statements involve risks and uncertainties because they relate to events, and depend on circumstances, that will or may occur in the future. Actual outcomes may differ depending on a variety of factors, including product supply, demand and pricing; political stability; general economic conditions; legal and regulatory developments; availability of new technologies; natural disasters and adverse weather conditions; wars and acts of terrorism or sabotage; and other factors discussed elsewhere in this presentation. BP disclaims any obligation to update this presentation. Neither BP p.l.c. nor any of its subsidiaries accept liability for any inaccuracies or omissions or for any direct, indirect, special, consequential or other losses or damages of whatsoever kind in connection to this presentation or any information contained in it.
http://www.bp.com/content/dam/bp/pd...-outlook-2015/Energy_Outlook_2035_booklet.pdf
So in a sentence "we are blowing smoke from our a-hole for you shareholer value types"

GLG
Well-Known Member
[h=2]Climate Change Discussion paper[/h]The Climate Change Discussion paper sets a clear vision and long-term and short-term goals for fighting climate change. It also asks important questions to inform a comprehensive climate change strategy and action plan.
[h=3]Vision[/h]
[h=3]Vision[/h]
- Establish Ontario as a leader in climate change mitigation and science
- Redesign and build strong carbon neutral economy, communities, infrastructure and energy
- Protect ecosystems including air land and water
- Leave a legacy of a healthy world for our children and future generations
- Action in key sectors such as transportation, buildings, electricity, industry and agriculture (e.g., expanded public transit, energy efficient buildings, renewable energy)
- Support science, research and technology to encourage the breakthroughs, discoveries and investments needed to reduce carbon use
- Promote climate resilience and risk management to ensure Ontario is prepared to effectively manage the risks of climate change
- Price on Carbon. Carbon pricing can spur clean technology research and development as emitters look for ways to reduce carbon and manage risk. Countries around the world are pricing carbon. Pricing carbon is also happening in Canada with British Columbia's carbon tax, Alberta's intensity-based system and Quebec's cap and trade program, which is linked with California
OldBlackDog
Well-Known Member
Train Derailment Fuels Debate Over Keystone, Oil Pipeline Safety
spillThe derailment of a train in West Virginia that sent flames soaring and at least some of the 3 million gallons of crude oil onboard into a Kanawha River tributary has prompted a renewed call for the approval of the Keystone XL pipeline as a safer alternative to rail transportation.
Daniel Kish, an Institute for Energy Research vice president, said Wednesday that trains remain a safe way to move oil and that the U.S. rail industry has met the demands of the recent domestic-energy boom.
But he said underground pipelines are safer.
“Any time you make more trips -- whether it’s trains, trucks or buses -- accidents increase,” he said. “I’m not trying to scare people. But the records show that if you move more stuff there will be more problems.”
Kish pointed to a State Department environmental-impact study that shows the number of stations for loading and unloading oil across Canada and the United States increased roughly 10-fold over the past four years. “I’m not opposed to these things being built,” Kish said. “But I have to say to myself: 'The fewer the number, the safer the transportation, which leads me to the pipeline being built.' "
The effort to complete the 1,700-mile-long pipeline, which would carry Canadian crude oil to Gulf Coast refineries, started six years ago and has become one of the country’s most politically charged issues.
Congress approved legislation this month to complete the XL pipeline extension, from Canada to Nebraska, after Republicans took control of the Senate in January. Republicans and other supporters argue the pipeline will create tens of thousands of new jobs and reduce the country’s dependency on foreign oil. However, President Obama has vowed to veto the bipartisan-backed bill, as long as the State Department is still conducting its own review of the TransCanada Corp. application.
Pipeline critics argue that drilling for crude in Canada’s tar sands will emit too much greenhouse gas and contribute to global warming. While supporters say pipelines are safer, critics say neither mode of transportation is safe.
"We've had 6,000 pipeline blowouts or leaks over just the past two decades," said Bob Deans, with the Natural Resources Defense Council.
In addition to the accident Monday in southern West Virginia, two other major rail incidents have occurred in the U.S. in roughly the past 15 months -- a train collision in Casselton, N.D., in December 2013, and an April 2014 derailment in Lynchburg, Va.
No deaths were reported in any of the three accidents. However, 47 people were killed in a July 2013 derailment in the Canadian town of Lac-Megantic.
All four trains were carrying crude oil from the Plains States’ oil rich Bakken shelf. Crude from there also will go the Gulf Coast refineries if the pipeline is completed.
North Dakota Sen. John Hoeven, a co-sponsor of the Keystone XL bill, and West Virginia Sen. Joe Manchin, who also backed the bill, declined to comment on whether the accident impacts the Keystone debate.
The accident occurred during a heavy snowstorm, igniting at least 14 tankers and burning down a house.
In addition, hundreds of families were evacuated and nearby water treatment plants were temporarily closed, prompting Gov. Earl Ray Tomblin to issue a state of emergency.
One person was treated for potential inhalation issues, but no other injuries were reported, according to a news release from CSX, the train company.
The company and the Federal Railroad Administration are assisting in the National Transportation Safety Board investigation.
“This accident is another reminder of the need to improve the safety of transporting hazardous materials by rail,” said acting agency Chairman Christopher Hart. “If we identify any new safety concerns as a result of this derailment, the board will act expeditiously to issue new safety recommendations.”
Meanwhile, the Transportation Department is weighing tougher safety regulations for rail shipments of crude, which can ignite and result in huge fireballs.
But the three recent accidents in the U.S. all involved tank cars that already meet a higher safety standard than what federal law requires -- leading some to suggest even tougher requirements that industry representatives say would be prohibitively costly.
Source
You have totally overlooked the efforts and patience of GLG, Dave. However - you are right. *BUT*...it hasn't slowed me down or kept me from moving fast or fishing. Thanks for the concern...Starting to think obd and aa are confined to wheel chairs ...
Attachments


- Status
- Not open for further replies.
Similar threads
- Replies
- 0
- Views
- 463
- Locked
- Replies
- 124
- Views
- 6K
- Replies
- 0
- Views
- 2K