Climate: LNG in B.C. vs Alberta tarsands

Status
Not open for further replies.
Again, that was not the question that you have not answered and no one else has.
Peer reviewed science that says global warming has not stopped for 18 plus years.
GLG is not peer reviewed science.

As for the alleged "pause" see http://www.washingtonpost.com/news/...ate-models-didnt-overestimate-global-warming/ and the article referenced therein http://www.nature.com/nature/journal/v517/n7536/full/nature14117.html (which is peer reviewed). Also see - http://www.climate.gov/news-feature...s-surface-temperature-stop-rising-past-decade and the multiple peer reviewed articles referenced therein. All support GLG's statements that you're showing cherry picked data.

BTW - you still haven't corrected your post #2207 in which you put your words into a previous post of mine as if they were mine.
 
As I said not a scientist. Therefore not qualified as you have said before. My reply to you is there, if you disagree with these scientists then email them or go on their sites and show them.
OBD - you are always qualified to have an opinion - and I welcome your input.

However, if you want to have a Science-based argument - then obviously you need to review and use the actual Science. Nobody needs to be a scientist to do that.

However, most of the denier blogs you post from have chunks of science embedded within their content - unfortunately it seems that most of the denier-likers lack the Science literacy to differentiate the BS from the Science.

If the denier blog writers actually had valid critiques of the available Science - they could easily publish their critiques themselves in the Science journals. That way - it would be open and available for all researchers. This is normal procedures for the Sciences.

However - and very noticeably - they have not. Some 97% of the Science agrees that climate change is real and exasperated by human activities. IMHO - they know how bad and misleading the content they post in their blogs actually is. So they don't publish - they can't. Only someone with limited Science literacy skills would not get this simple fact.

If I disagreed with the people you incorrectly perceive as climate "scientists" - then the correct way to do that would be to submit a letter of comment against their peer-reviewed work. The only problem with that is that your bloggers don't publish because what they post in their blogs is largely *NOT* Science and would be turfed-out by anyone with Science literacy. So - no - we can't have that debate - because there really is no debate in the Sciences.

Another simple fact - recently a few climate change researchers have taken their denier bloggers and news sources to task in the courts. Even the courts can see how badly the deniers have slandered the climate change researchers and their Science. The courts need a fairly high level of evidence for this - and they have found it. The courts have agreed that the deniers have needlessly and inappropriately slandered the climate researchers and their Science. In other words - the courts have agreed that in the cases they have heard - the denier bloggers tell falsehoods. That has been proven in the courts - where there is a high standard for evidence. We should stop and think about that messaging from the courts - and maybe - just maybe - go back to the peer-reviewed Science and read it ourselves rather than blindly cutting and pasting from bloggers hoping that we will "win" the PR war by posting more sh*t than the scientists on a Sportsfishing Forum.
 
Last edited by a moderator:
Well, nothing there says that I am wrong and you are right. Interesting now,that we are finding out that scientists are fixing the temperatures to meet their agendas.


As for the alleged "pause" see http://www.washingtonpost.com/news/...ate-models-didnt-overestimate-global-warming/ and the article referenced therein http://www.nature.com/nature/journal/v517/n7536/full/nature14117.html (which is peer reviewed). Also see - http://www.climate.gov/news-feature...s-surface-temperature-stop-rising-past-decade and the multiple peer reviewed articles referenced therein. All support GLG's statements that you're showing cherry picked data.

BTW - you still haven't corrected your post #2207 in which you put your words into a previous post of mine as if they were mine.


Attachments

  • Nuccitelli_OHC_Data_med.jpg
    Nuccitelli_OHC_Data_med.jpg
    16.8 KB · Views: 29
  • Levitus2012OHC.jpg
    Levitus2012OHC.jpg
    58.6 KB · Views: 29
  • Argo_Array.jpg
    Argo_Array.jpg
    20.9 KB · Views: 29
  • GuemasFig1.jpg
    GuemasFig1.jpg
    19.1 KB · Views: 29
  • GuemasFig3.jpg
    GuemasFig3.jpg
    18.2 KB · Views: 29
Last edited by a moderator:
Really, do I have to go through all your posts to show that you do not use peer reviewed science?
That you use newspapers to get your point across?
For that matter all of you like to use the , I am right because I always use science. Yet you don't.
I do not care and I am not playing by your rules as you don't.

Remember what this argument is about.
You said that man is responsible for global warming due to CO2.
That there to be no arguments about this because it is over. We are right and there will be no discussions on that.

So far the world has not warmed up in the last 18 years plus and now it is questionable about how much scientists are playing with historical temperatures for their benefit.

And the interesting thing is more people are questioning what the governments are selling on this.

OBD - you are always qualified to have an opinion - and I welcome your input.

However, if you want to have a Science-based argument - then obviously you need to review and use the actual Science. Nobody needs to be a scientist to do that.

However, most of the denier blogs you post from have chunks of science embedded within their content - unfortunately it seems that most of the denier-likers lack the Science literacy to differentiate the BS from the Science.

If the denier blog writers actually had valid critiques of the available Science - they could easily publish their critiques themselves in the Science journals. That way - it would be open and available for all researchers. This is normal procedures for the Sciences.

However - and very noticeably - they have not. Some 97% of the Science agrees that climate change is real and exasperated by human activities. IMHO - they know how bad and misleading the content they post in their blogs actually is. So they don't publish - they can't. Only someone with limited Science literacy skills would not get this simple fact.

If I disagreed with the people you incorrectly perceive as climate "scientists" - then the correct way to do that would be to submit a letter of comment against their peer-reviewed work. The only problem with that is that your bloggers don't publish because what they post in their blogs is largely *NOT* Science and would be turfed-out by anyone with Science literacy. So - no - we can't have that debate - because there really is no debate in the Sciences.

Another simple fact - recently a few climate change researchers have taken their denier bloggers and news sources to task in the courts. Even the courts can see how badly the deniers have slandered the climate change researchers and their Science. The courts need a fairly high level of evidence for this - and they have found it. The courts have agreed that the deniers have needlessly and inappropriately slandered the climate researchers and their Science. In other words - the courts have agreed that in the cases they have heard - the denier bloggers tell falsehoods. That has been proven in the courts - where there is a high standard for evidence. We should stop and think about that messaging from the courts - and maybe - just maybe - go back to the peer-reviewed Science and read it ourselves rather than blindly cutting and pasting from bloggers hoping that we will "win" the PR war by posting more sh*t than the scientists on a Sportsfishing Forum.
 
Really, do I have to go through all your posts to show that you do not use peer reviewed science? That you use newspapers to get your point across? For that matter all of you like to use the , I am right because I always use science. Yet you don't.
if you go back a few posts to 02-08-2015, 07:46 AM post #2182 http://www.sportfishingbc.com/forum...limate-LNG-in-B-C-vs-Alberta-tarsands/page219 you will find what I actually said was:
I do post news and the occasional Op Ed in a newspaper, for sure - you are right, OBD.

However, I post quite a bit of peer-reviewed science, OBD.

The bloggers you post (and the assumed science contained within) are not peer-reviewed. If they really had these concerns over any particular piece of science - any article - they could either publish themselves and/or publish a comment in the same journals that published the original article with their critiques. They do neither because the sh*t they pull in cherry-picking data and truncating graphs would be spotted in an instant by anyone with Science skills. Their blogs, then - are the only place that they can get "published". Be careful OBD - there is quite a bit of "opinions" not backed-up with the most relevant and current Science out there. ALWAYS go back to the peer-reviewed Science - no matter who's opinion you like.

That's the point I was making.
 
In the era before Argo (2003), measurements of ocean temperature were made from ships by putting a thermometer in a bucket of water drawn up from the surface or in the inlet valves of the engines, or by diving darts (XBTs) that could dive down to 800m with a thermometer, transmitting the data back to the ship along thin wires. The uncertainties in the temperature measurements made by the XBTs falling through the ocean were huge, because the XBTs fell too quickly to come into thermal equilibrium with the water around them. Also, there is a very strong temperature gradient in the surface layer of the ocean to below the thermocline , so the depth attributed to each temperature data point is arrived at from an assumed rate of descent of the instrument. Any deviation from the assumed rate of descent will put the instrument (and temperature) at the wrong depth, making the calculated temperature still more uncertain. Measurements from thermometers in buckets of water variously obtained are obviously hugely imprecise.

The geographic distribution of the sampling was sparse and very uneven, because the samples were taken along commercial shipping routes, somewhat irregularly. Most shipping lanes are in the northern hemisphere, but most of the world’s oceans are in the southern hemisphere — much of the southern ocean is hundreds or thousands of kilometers from where samples were taken. The oceans are really big, yet the presence of currents and layers at different temperatures means temperatures can be quite different in waters just a few hundred meters apart.

Obviously the errors are so huge compared to the expected/modeled increases (less than a tenth of a degree C per decade) that pre-Argo data is useless. One wonders at the morals of people using this data to convince people the world is warming.


Really, you have checked that there was no fixing?


For you 1st point: that would be called Science, OBD. For your second point: BS
 
Last edited by a moderator:
Warming stays on the Great Shelf
Anthony Watts / 1 hour ago February 9, 2015
Global temperature update: the Pause is now 18 years 2 months

By Christopher Monckton of Brenchley

Since December 1996 there has been no global warming at all (Fig. 1). This month’s RSS temperature shows a sharp uptick to warmer worldwide weather than for two years, shortening the period without warming by a month to 18 years 2 months.

clip_image002

Figure 1. The least-squares linear-regression trend on the RSS satellite monthly global mean surface temperature anomaly dataset shows no global warming for 18 years 2 months since December 1996.

The hiatus period of 18 years 2 months, or 218 months, is the farthest back one can go in the RSS satellite temperature record and still show a sub-zero trend.

As papers continue to appear in the literature claiming that the climate models were right all along except that they were wrong, the widening of the divergence between excitable prediction and unalarming reality continues (Fig. 2).

clip_image004

Figure 2. Near-term projections of warming at a rate equivalent to 2.8 [1.9, 4.2] K/century, made with “substantial confidence” in IPCC (1990), January 1990 to January 2015 (orange region and red trend line), vs. observed anomalies (dark blue) and trend (bright blue) at less than 1.4 K/century equivalent, taken as the mean of the RSS and UAH satellite monthly mean lower-troposphere temperature anomalies.

A quarter-century after 1990, the global-warming outturn to date – expressed as the least-squares linear-regression trend on the mean of the RSS and UAH monthly global mean surface temperature anomalies – is 0.34 Cº, equivalent to just 1.4 Cº/century, or a little below half of the central estimate of 0.70 Cº, equivalent to 2.8 Cº/century, in IPCC (1990). The outturn is well below even the least estimate.

Remarkably, even the IPCC’s latest and much reduced near-term global-warming projections are also excessive (Fig. 3).

clip_image006

Figure 3. Predicted temperature change, January 2005 to January 2015, at a rate equivalent to 1.7 [1.0, 2.3] Cº/century (orange zone with thick red best-estimate trend line), compared with the near-zero observed anomalies (dark blue) and zero real-world trend (bright blue), taken as the average of the RSS and UAH satellite lower-troposphere temperature anomalies.

In 1990, the IPCC’s central estimate of near-term warming was higher by two-thirds than it is today. Then it was 2.8 C/century equivalent. Now it is just 1.7 Cº equivalent – and, as Fig. 3 shows, even that is proving to be a substantial exaggeration.

On the RSS satellite data, there has been no global warming statistically distinguishable from zero for more than 26 years. None of the models predicted that, in effect, there would be no global warming for a quarter of a century.

Key facts about global temperature

Ø The RSS satellite dataset shows no global warming at all for 218 months from December 1996 to January 2014 – more than half the 432-month satellite record.

Ø The global warming trend since 1900 is equivalent to 0.8 Cº per century. This is well within natural variability and may not have much to do with us.

Ø Since 1950, when a human influence on global temperature first became theoretically possible, the global warming trend has been equivalent to below 1.2 Cº per century.

Ø The fastest warming rate lasting ten years or more since 1950 occurred over the 33 years from 1974 to 2006. It was equivalent to 2.0 Cº per century.

Ø In 1990, the IPCC’s mid-range prediction of near-term warming was equivalent to 2.8 Cº per century, higher by two-thirds than its current prediction of 1.7 Cº/century.

Ø The global warming trend since 1990, when the IPCC wrote its first report, is equivalent to below 1.4 Cº per century – half of what the IPCC had then predicted.

Ø Though the IPCC has cut its near-term warming prediction, it has not cut its high-end business as usual centennial warming prediction of 4.8 Cº warming to 2100.

Ø The IPCC’s predicted 4.8 Cº warming by 2100 is well over twice the greatest rate of warming lasting more than ten years that has been measured since 1950.

Ø The IPCC’s 4.8 Cº-by-2100 prediction is almost four times the observed real-world warming trend since we might in theory have begun influencing it in 1950.

Ø From September 2001 to November 2014, the warming trend on the mean of the 5 global-temperature datasets is nil. No warming for 13 years 3 months.

Ø Recent extreme weather cannot be blamed on global warming, because there has not been any global warming. It is as simple as that.

Technical note

Our latest topical graph shows the least-squares linear-regression trend on the RSS satellite monthly global mean lower-troposphere dataset for as far back as it is possible to go and still find a zero trend. The start-date is not “cherry-picked” so as to coincide with the temperature spike caused by the 1998 el Niño. Instead, it is calculated so as to find the longest period with a zero trend.

The RSS dataset is arguably less unreliable than other datasets in that it shows the 1998 Great El Niño more clearly than all other datasets (though UAH runs it close). The Great el Niño, like its two predecessors in the past 300 years, caused widespread global coral bleaching, providing an independent verification that RSS is better able to capture such fluctuations without artificially filtering them out than other datasets. Besides, there is in practice little statistical difference between the RSS and other datasets over the 18-year period of the Great Pause.

Terrestrial temperatures are measured by thermometers. Thermometers correctly sited in rural areas away from manmade heat sources show warming rates appreciably below those that are published. The satellite datasets are based on reference measurements made by the most accurate thermometers available – platinum resistance thermometers, which provide an independent verification of the temperature measurements by checking via spaceward mirrors the known temperature of the cosmic background radiation, which is 1% of the freezing point of water, or just 2.73 degrees above absolute zero. It was by measuring minuscule variations in the cosmic background radiation that the NASA anisotropy probe determined the age of the Universe: 13.82 billion years.

The RSS graph (Fig. 1) is accurate. The data are lifted monthly straight from the RSS website. A computer algorithm reads them down from the text file, takes their mean and plots them automatically using an advanced routine that automatically adjusts the aspect ratio of the data window at both axes so as to show the data at maximum scale, for clarity.

The latest monthly data point is visually inspected to ensure that it has been correctly positioned. The light blue trend line plotted across the dark blue spline-curve that shows the actual data is determined by the method of least-squares linear regression, which calculates the y-intercept and slope of the line via two well-established and functionally identical equations that are compared with one another to ensure no discrepancy between them. The IPCC and most other agencies use linear regression to determine global temperature trends. Professor Phil Jones of the University of East Anglia recommends it in one of the Climategate emails. The method is appropriate because global temperature records exhibit little auto-regression.

Dr Stephen Farish, Professor of Epidemiological Statistics at the University of Melbourne, kindly verified the reliability of the algorithm that determines the trend on the graph and the correlation coefficient, which is very low because, though the data are highly variable, the trend is flat.

RSS itself is now taking a serious interest in the length of the Great Pause. Dr Carl Mears, the senior research scientist at RSS, discusses it at remss.co
 

Attachments

  • image.jpg
    image.jpg
    60.7 KB · Views: 44
  • image.jpg
    image.jpg
    61.6 KB · Views: 44
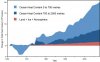
Dr Mears’ results are summarized in Fig. 4:

clip_image008

Figure 4. Output of 33 IPCC models (turquoise) compared with measured RSS global temperature change (black), 1979-2014. The transient coolings caused by the volcanic eruptions of Chichón (1983) and Pinatubo (1991) are shown, as is the spike in warming caused by the great el Niño of 1998.

Dr Mears writes:

“The denialists like to assume that the cause for the model/observation discrepancy is some kind of problem with the fundamental model physics, and they pooh-pooh any other sort of explanation. This leads them to conclude, very likely erroneously, that the long-term sensitivity of the climate is much less than is currently thought.”

Dr Mears concedes the growing discrepancy between the RSS data and the models, but he alleges “cherry-picking” of the start-date for the global-temperature graph:

“Recently, a number of articles in the mainstream press have pointed out that there appears to have been little or no change in globally averaged temperature over the last two decades. Because of this, we are getting a lot of questions along the lines of ‘I saw this plot on a denialist web site. Is this really your data?’ While some of these reports have ‘cherry-picked’ their end points to make their evidence seem even stronger, there is not much doubt that the rate of warming since the late 1990s is less than that predicted by most of the IPCC AR5 simulations of historical climate. … The denialists really like to fit trends starting in 1997, so that the huge 1997-98 ENSO event is at the start of their time series, resulting in a linear fit with the smallest possible slope.”

In fact, the spike in temperatures caused by the Great el Niño of 1998 is largely offset in the linear-trend calculation by two factors: the not dissimilar spike of the 2010 el Niño, and the sheer length of the Great Pause itself.

Curiously, Dr Mears prefers the much-altered terrestrial datasets to the satellite datasets. However, over the entire length of the RSS and UAH series since 1979, the trends on the mean of the terrestrial datasets and on the mean of the satellite datasets are near-identical. Indeed, the UK Met Office uses the satellite record to calibrate its own terrestrial record.

The length of the Great Pause in global warming, significant though it now is, is of less importance than the ever-growing discrepancy between the temperature trends predicted by models and the far less exciting real-world temperature change that has been observed. It remains possible that el Nino-like conditions may prevail this year, reducing the length of the Great Pause. However, the discrepancy between prediction and observation continues to widen.

IPCC’s First Assessment Report predicted that global temperature would rise by 1.0 [0.7, 1.5] Cº to 2025, equivalent to 2.8 [1.9, 4.2] Cº per century. The executive summary asked, “How much confidence do we have in our predictions?” IPCC pointed out some uncertainties (clouds, oceans, etc.), but concluded:

“Nevertheless, … we have substantial confidence that models can predict at least the broad-scale features of climate change. … There are similarities between results from the coupled models using simple representations of the ocean and those using more sophisticated descriptions, and our understanding of such differences as do occur gives us some confidence in the results.”

That “substantial confidence” was substantial over-confidence. For the rate of global warming since 1990 – the most important of the “broad-scale features of climate change” that the models were supposed to predict – is now below half what the IPCC had then predicted.

Is the ocean warming?

One frequently-discussed explanation for the Great Pause is that the coupled ocean-atmosphere system has continued to accumulate heat at approximately the rate predicted by the models, but that in recent decades the heat has been removed from the atmosphere by the ocean and, since globally the near-surface strata show far less warming than the models had predicted, it is hypothesized that what is called the “missing heat” has traveled to the little-measured abyssal strata below 2000 m, whence it may emerge at some future date.

Yet to date no empirical, theoretical or numerical method, complex or simple, has yet successfully specified mechanistically either how the heat generated by anthropogenic greenhouse-gas enrichment of the atmosphere has reached the deep ocean without much altering the heat content of the intervening near-surface strata or how the heat from the bottom of the ocean may eventually re-emerge to perturb the near-surface climate conditions that are relevant to land-based life on Earth.

Most ocean models used in performing coupled general-circulation model sensitivity runs simply cannot resolve most of the physical processes relevant for capturing heat uptake by the deep ocean. Ultimately, the second law of thermodynamics requires that any heat which may have accumulated in the deep ocean will dissipate via various diffusive processes. It is not plausible that any heat taken up by the deep ocean will suddenly warm the upper ocean and, via the upper ocean, the atmosphere.

If the “deep heat” explanation for the hiatus in global warming is correct (and it is merely one among dozens that have been offered), then the complex models have failed to account for it correctly: otherwise, the growing discrepancy between the predicted and observed atmospheric warming rates would not have become as significant as it has.

Besides, the 3500 automated Argo bathythermograph buoys have a resolution equivalent to taking a single temperature and salinity profile in Lake Superior less than once a year: and before Argo came onstream in the middle of the last decade the resolution of oceanic temperature measurements was considerably poorer even than that, especially in the abyssal strata.

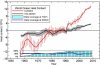
Finally, though the ARGO buoys measure ocean temperature change directly, before publication NOAA craftily convert the temperature change into zettajoules of ocean heat content change, which make the change seem larger. Converting the ocean heat content change back to temperature change reveals just how little ocean warming is occurring.

Is some underlying rate of global warming captured by the ocean temperature measurements? Well, the terrifying-sounding heat content change of 260 ZJ from 1970 to 2014 is equivalent to just 0.2 K/century of global warming.

clip_image010

Figure 5. Ocean heat content change, 1957-2013, in Zettajoules from NODC Ocean Climate Lab: http://www.nodc.noaa.gov/OC5/3M_HEAT_CONTENT. The heat content has been converted back to the ocean temperature changes in fractions of a Kelvin that were originally measured. NOAA’s conversion of the minuscule temperature change data to Zettajoules, combined with the exaggerated vertical aspect of the graph, has the effect of making a very small change in ocean temperature seem considerably more significant than it is.
 
Science Communication Is Broken. Let's Fix It.

The first scientific journals appeared in the late 17th century, when exclusive groups of scientists in Britain and France began recording their results for posterity. Only select aristocrats could participate in the endeavor of research, and their social circles were formalized in organizations like the Royal Society. Science was closed to the public.

Since then very little has changed. Societies for science still only accept well-established scientists who pay large membership dues. Journals of science are still only distributed to and read by paying subscribers: research institutions and rich scientists. Science communication is outdated.

The term "peer-reviewed journal" has become imbued with a connotation of thoroughness and prestige that masks its true identity. In reality there are over 10,000 journals worldwide, and scientists compete for spots in the most expensive and prestigious ones. Both scientists and their readers face ridiculous charges: thousands of dollars and $30-plus per article, respectively. Publishers claim these funds are necessary for the almighty sacred cow of research publishing: peer review. In reality, though, the costs for the minor review changes made to initial manuscripts is far lower, and the benefits are negligible. The peer-review process is slow and can actually block innovative ideas. Some scientists have gone so far as to show the holes in the system by publishing nonsensical articles in respected journals.From lab to print, research becomes a muddled mess while publishing industries thrive on ridiculous profits exceeding 30 percent annually.

This system is only able to survive because scientists are forced to "publish or perish" in an era of hyper-competitive grants and limited faculty jobs in the face of an overwhelming surfeit of postdocs. This immense pressure on scientists is destroying innovation. As Sydney Brenner lamented in regard to fellow (two-time) Nobel laureate Fred Sanger, today's research funding system does not support risky, long-term projects due to the pressure of publishing.

2015-02-06-sanger.png

The solution lies in science communication. We live in an era where the public needs to know about science. Research is no longer funded by the private monies of rich aristocrats; grants for science come from the pockets of the layperson via charitable organizations and taxpayer money. Public opinion of science determines where this money goes through policy and funding. A clear example of this today is the relationship between public opinion and funding for climate change research. Yet, as recent studies by the Pew Institute show, there is a significant disparity between public opinion and that of scientists in virtually every field.

Today, science journalism is the primary connection between discoveries in lab and the general public. However, the scope of such communication is limited by the knowledge of the authors, who often oversimplify concepts in an attempt to make the informations accessible. Ultimately, these pieces can fail in ways ranging from exaggerating the results to being completely inaccurate. Accordingly, it is up to researchers themselves to pioneer and revolutionize science communication. Scientists are becoming increasingly aware of this: "Communication of science to the general public is increasingly recognized as a responsibility of scientists (Greenwood, 2001; Leshner, 2003)" (Brownell, 2013). The solution is two-pronged: (a) transform the centuries-old, traditional publishing system, and (b) create new venues for science communication.

The first objective has burgeoned under the banner of open science. The science community has taken a quantum leap toward transparent research communication through several relatively new initiatives:

ReadCube: Nature (among other journals) diversified the uses of this article PDF viewer to allow subscribers to share read-only, annotated copies of papers with any reader.
Altmetrics: This new metric for article popularity/prestige encourages scientific discussion by measuring articles by their appearance throughout the Internet on websites, blogs, and social media.
The Winnower: The philosophy behind this open-access, open-post publication peer-review publisher is transparency from start to finish.
PLOS (and others): Many journals are beginning to accept the open-access paradigm for making articles accessible to all people, starting with PLOS.
Meanwhile, alternative means of science communication are growing equally quickly in the blogosphere:

ScienceGist: This recently closed service used to offer community-developed lay summaries of research articles. However, other alternatives (described below) are working to fill their shoes.
UsefulScience: The idea is deceivingly simple -- creating one-sentence summaries of research articles. In lieu of skimming jargon-filled, incomprehensible titles for articles, reading UsefulScience is a perfect alternative.
Draw Science: Science articles are undeniably boring; who enjoys reading large masses of esoteric text? Draw Science turns these long-winding papers into interesting, easy-to-read infographics for the layperson and tbe scientist alike.
SciWorthy: This is a more traditional website for readers to consult for science news, as they would consult TechCrunch or Engadget for technology news. SciWorthy also welcomes scientists to submit their own works.
Publiscize: Scientists are now tooled to make their own research open to all people via this website, which offers real-time, individual feedback from editors and an extended set of tools to maximize reader impact.
AcaWiki: This service is geared more at scientist-to-scientist communication, especially for graduate students, to summarize less-popular academic papers that would otherwise remain untouched.
The success of the aforementioned initiatives -- as well as new grassroots ideas -- is promising for the future of science communication. As we move away from an antiquated system of publishing to a new format of science communication, we must consider its implications for research as a whole. With the greater empowerment of the individual to create meaningful change in research, science is undergoing its own "indie" revolution with rising numbers of independent researchers and institutions. The focus of the science community is now shifting from #openscience to #indiesci, and the largely online movement will continue to redefine how, where, and who does research.

Follow Vip Sitaraman on Twitter: www.twitter.com/viputheshwar
 
Well, nothing there says that I am wrong and you are right. Interesting now,that we are finding out that scientists are fixing the temperatures to meet their agendas.

quote_icon.png
Originally Posted by seadna

As for the alleged "pause" see http://www.washingtonpost.com/news/e...lobal-warming/ and the article referenced therein http://www.nature.com/nature/journal...ture14117.html (which is peer reviewed). Also see - http://www.climate.gov/news-features...ng-past-decade and the multiple peer reviewed articles referenced therein. All support GLG's statements that you're showing cherry picked data.

BTW - you still haven't corrected your post #2207 in which you put your words into a previous post of mine as if they were mine.

Thanks seadna for the links. Very interesting reading and lots of links to papers that have very good information.

Two things OBD.....

First can you edit your post as you have been asked?
Perhaps use cut/paste and put your reply after the last /quote
If you can't do that then perhaps highlite your reply and use the A^ drop down and change the colour and add "OBD Reply". Ignoring this simple request is not helping you case.

Second OBD you missed this one.
http://onlinelibrary.wiley.com/doi/10.1002/2014GL060962/full


Changes in global net radiative imbalance 1985–2012
Abstract


Combining satellite data, atmospheric reanalyses, and climate model simulations, variability in the net downward radiative flux imbalance at the top of Earth's atmosphere (N) is reconstructed and linked to recent climate change. Over the 1985–1999 period mean N (0.34 ± 0.67 Wm[SUP]−2[/SUP]) is lower than for the 2000–2012 period (0.62 ± 0.43 Wm[SUP]−2[/SUP], uncertainties at 90% confidence level) despite the slower rate of surface temperature rise since 2000. While the precise magnitude of N remains uncertain, the reconstruction captures interannual variability which is dominated by the eruption of Mount Pinatubo in 1991 and the El Niño Southern Oscillation. Monthly deseasonalized interannual variability in N generated by an ensemble of nine climate model simulations using prescribed sea surface temperature and radiative forcings and from the satellite-based reconstruction is significantly correlated (r∼0.6) over the 1985–2012 period.

Or this one

http://iopscience.iop.org/1748-9326/6/4/044022

Global temperature evolution 1979–2010

We analyze five prominent time series of global temperature (over land and ocean) for their common time interval since 1979: three surface temperature records (from NASA/GISS, NOAA/NCDC and HadCRU) and two lower-troposphere (LT) temperature records based on satellite microwave sensors (from RSS and UAH). All five series show consistent global warming trends ranging from 0.014 to 0.018 K yr−1. When the data are adjusted to remove the estimated impact of known factors on short-term temperature variations (El Niño/southern oscillation, volcanic aerosols and solar variability), the global warming signal becomes even more evident as noise is reduced. Lower-troposphere temperature responds more strongly to El Niño/southern oscillation and to volcanic forcing than surface temperature data. The adjusted data show warming at very similar rates to the unadjusted data, with smaller probable errors, and the warming rate is steady over the whole time interval. In all adjusted series, the two hottest years are 2009 and 2010.


Or this one


Earth's energy imbalance and implications
http://www.atmos-chem-phys-discuss.net/11/27031/2011/acpd-11-27031-2011.html

Abstract. Improving observations of ocean heat content show that Earth is absorbing more energy from the sun than it is radiating to space as heat, even during the recent solar minimum. The inferred planetary energy imbalance, 0.59 ± 0.15 W m[SUP]−2[/SUP] during the 6-year period 2005–2010, confirms the dominant role of the human-made greenhouse effect in driving global climate change. Observed surface temperature change and ocean heat gain together constrain the net climate forcing and ocean mixing rates. We conclude that most climate models mix heat too efficiently into the deep ocean and as a result underestimate the negative forcing by human-made aerosols. Aerosol climate forcing today is inferred to be −1.6 ± 0.3 W m[SUP]−2[/SUP], implying substantial aerosol indirect climate forcing via cloud changes. Continued failure to quantify the specific origins of this large forcing is untenable, as knowledge of changing aerosol effects is needed to understand future climate change. We conclude that recent slowdown of ocean heat uptake was caused by a delayed rebound effect from Mount Pinatubo aerosols and a deep prolonged solar minimum. Observed sea level rise during the Argo float era is readily accounted for by ice melt and ocean thermal expansion, but the ascendency of ice melt leads us to anticipate acceleration of the rate of sea level rise this decade.

Or this.......

Earth's energy imbalance since 1960 in observations and CMIP5 models
http://onlinelibrary.wiley.com/doi/10.1002/2014GL062669/abstract

Abstract

Observational analyses of running 5-year ocean heat content trends (H[SUB]t[/SUB]) and net downward top of atmosphere radiation (N) are significantly correlated (r~0.6) from 1960 to 1999, but a spike in H[SUB]t[/SUB] in the early 2000s is likely spurious since it is inconsistent with estimates of N from both satellite observations and climate model simulations. Variations in N between 1960 and 2000 were dominated by volcanic eruptions, and are well simulated by the ensemble mean of coupled models from the Fifth Coupled Model Intercomparison Project (CMIP5). We find an observation-based reduction in N of -0.31±0.21 Wm[SUP]-2[/SUP] between 1999 and 2005 that potentially contributed to the recent warming slowdown, but the relative roles of external forcing and internal variability remain unclear. While present-day anomalies of N in the CMIP5 ensemble mean and observations agree, this may be due to a cancellation of errors in outgoing longwave and absorbed solar radiation.


I could go on and on but I know what you are going to say....
Really..... I don't believe it because Lord Monckton has something new

Yes OBD you are the black knight.....
[zKhEw7nD9C4]https://www.youtube.com/watch?v=zKhEw7nD9C4
 
[UnUNnW2DH_M]https://www.youtube.com/watch?v=UnUNnW2DH_M#t=10
 
Really, you have checked that there was no fixing?
Firstly, OBD it is called "calibrating", and is good scientific practice, and Secondly you actually said was:
scientists are fixing the temperatures to meet their agendas.
Their "agenda" OBD - is scientific accuracy. *ALL* Scientific instruments are calibrated. Some are calibrated before they leave the factory - others are so sensitive and record such sensitive changes in the parameter being measured that they need to be constantly calibrated (like some temperature recorders). Most instruments fit somewhere in-between. This is no startling fact to anyone who works with this equipment. It is normal, and has been happening for many, many years before the climate denier bloggers suddenly became surprised.

Let's take you H2S meters that you use in your industry. Apparently, they need to be calibrated every 180 days or so: http://sensorcon.com/calibration-instructions for that model and maker. Nobody that I know of is now suddenly surprised that you are "fixing" your H2S readings to "meet your agenda". Your industry uses these instruments all the time and nobody thinks anything of it - especially the climate change denier bloggers.

But the climate deniers get away with saying this sh*t you because you WANT TO believe them - it is your new religion.
In the era before Argo (2003), measurements of ocean temperature were made from ships by putting a thermometer in a bucket of water drawn up from the surface or in the inlet valves of the engines, or by diving darts (XBTs) that could dive down to 800m with a thermometer, transmitting the data back to the ship along thin wires.
Such drivel. Scientists have had more than buckets since the late 1800s, OBD.
...The first scientific journals appeared in the late 17th century, when exclusive groups of scientists in Britain and France began recording their results for posterity. Only select aristocrats could participate in the endeavor of research, and their social circles were formalized in organizations like the Royal Society. Science was closed to the public...Since then very little has changed.
This is even worse than the normal drivel you post OBD - they are out-and-out lying. Lying is *NOT* a virtue either, OBD. Ignorance can sometimes be overlooked - but not out-and-out lying. I understand you wish to remain ignorant of Science and the scientific process - don't think - for a moment - the rest of us are though.
 
Last edited by a moderator:
I'm loathe to get involved in this endless debate however in the interest of accuracy the quote about how sea temps were recorded is accurate and not drivel. Use of ships intakes as well as XBT's provided the majority of sea temp info. While Scientists may have had other means to gather info, like a recoverable BT. They simply had no means to cover the vast areas of the ocean. As such Navy and other government vessels were tasked to record inlet temperatures hourly and take and record an XBT once per watch. At times various Universities would ask to have XBT's taken hourly or more frequently for specific studies. At any rate until the advent of satellite monitoring, which wasn't of course available in the 1800's, temperatures were recorded via bucket, inlet and Bathythermograph. The X in XBT stand for expendable, as in expendable bathythermograph.
 
http://www.sciencedaily.com/releases/2015/02/150209130734.htm

New evidence of global warming: Remote lakes in Ecuador not immune to climate change
Date: February 9, 2015
Source: Queen's University
Summary: A study of three remote lakes in Ecuador has revealed the vulnerability of tropical high mountain lakes to global climate change -- the first study of its kind to show this. The data explains how the lakes are changing due to the water warming as the result of climate change.

Journal Reference: Neal Michelutti, Alexander P. Wolfe, Colin A. Cooke, William O. Hobbs, Mathias Vuille, John P. Smol. Climate Change Forces New Ecological States in Tropical Andean Lakes. PLOS ONE, 2015; 10 (2): e0115338 DOI: 10.1371/journal.pone.0115338 http://dx.doi.org/10.1371/journal.pone.0115338
 
I'm loathe to get involved in this endless debate however in the interest of accuracy the quote about how sea temps were recorded is accurate and not drivel. Use of ships intakes as well as XBT's provided the majority of sea temp info. While Scientists may have had other means to gather info, like a recoverable BT. They simply had no means to cover the vast areas of the ocean. As such Navy and other government vessels were tasked to record inlet temperatures hourly and take and record an XBT once per watch. At times various Universities would ask to have XBT's taken hourly or more frequently for specific studies. At any rate until the advent of satellite monitoring, which wasn't of course available in the 1800's, temperatures were recorded via bucket, inlet and Bathythermograph. The X in XBT stand for expendable, as in expendable bathythermograph.
Thanks for this Ziggy. I was - of course - alluding to the satellite technology - although that blog is still misleading as there have been weather buoys in service since the 1970s: http://en.wikipedia.org/wiki/Weather_buoy

"Between 1951 and 1970, a total of 21 NOMAD buoys were built and deployed at sea.[3] Since the 1970s, weather buoy use has superseded the role of weather ships by design, as they are cheaper to operate and maintain.[4] The earliest reported use of drifting buoys was to study the behavior of ocean currents within the Sargasso Sea in 1972 and 1973.[5] Drifting buoys have been used increasingly since 1979, and as of 2005, 1250 drifting buoys roamed the Earth's oceans.[6]"

Weather buoys use neither ships intakes nor XBT.

In addition, satellite pop-up tags and similar technology has been used since 1998: http://en.wikipedia.org/wiki/Pop-up_satellite_archival_tag

Van Dorn and modern improvements to that method have been used since the 1930s to get water samples at depths.

so no - this blog article is still not accurate about both the dates, and the availability of different platforms and different sampling methodologies and equipment.
 
Last edited by a moderator:
Well, nothing there says that I am wrong and you are right. Interesting now,that we are finding out that scientists are fixing the temperatures to meet their agendas.

Actually, there is plenty there that says you are wrong. BUT, you'd have to both READ AND COMPREHEND it. I know you didn't read it given that only 31 mins passed between my post and your reply and you spent many of those minutes writing other stuff. So let's assume you had (and this is generous), 25 mins to read and understand the material provided (and references therein). If your reading speed is average - 275 words/minute, you could have read 6875 words during that time. The links I provided and the references therein contain far more words than that. So we can say with pretty high certainty that you did not in fact read the materials provided. We can also say with certainty that you claim those materials (which I'm pretty certain you didn't read), don't contain anything that disproves your point. From this, I draw the conclusion that you are simply making crap up as you most likely made your claim without reading the materials and hence couldn't know.

As for scientists "fixing the temperatures to meet their agendas" - that's also BS. There are a large number of reasons to apply corrections to temperature measurements (not the least of which is that many stations are in highly populated areas where the thermal mass has increased over time as cement buildings and other structures were built). Again, if you really took the time to read and understand the primary literature, you'd understand this.

The people who have the most to gain from discrediting science as those who work in and profit from the oil industry and they are working quite hard on the disinformation campaign.
 
Status
Not open for further replies.
Back
Top