Key observations from CWT and genetic analysis are as follows:
• The highest estimated CWT recoveries for Canadian exploitation rate indicator stocks were from Chilliwack, Harrison, and Cowichan stocks, with estimates of 76.1, 40.5, and 37.6 respectively during the 2022 calendar year (Table 7). By comparison, total estimated CWT recoveries for the 2022 calendar year from Canadian salmon-directed fisheries in marine areas was 178.1, 87.8, and 276.6 for Chilliwack, Harrison, and Cowichan stocks respectively. Comparisons between estimated CWT recoveries in fisheries are based on CWT sampling over the entire year in salmon-directed fisheries, while trawl CWT sampling occurred from September 26 to December 31, 2022 and has not been expanded to represent catch prior to the enhanced monitoring period.
• Other Canadian exploitation rate indicator stocks in trawl samples included Big Qualicum River, Nicola River, Robertson Creek, Puntledge River, and Quinsam River. Estimated CWT recoveries of the US Samish River indicator stock, included as a proxy for Boundary Bay Chinook, was 63.1 in 2022. There were no CWT recoveries of the Similkameen River stock, which is used as a proxy for Canadian Okanagan Chinook. Proxies were used to provide an indication of potential fisheries catch for Boundary Bay and Canadian Okanagan Chinook because there is no Canadian indicator stock for these populations (Dionne et al. 2023, Matylewich et al. 2019).
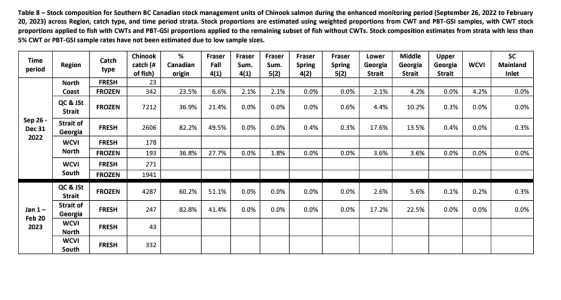
• The stock composition of Chinook salmon represented by Canadian-origin stocks, as estimated based upon combined CWT and PBT-GSI information, varied from 21% to 83% among catch strata. The highest proportions of Canadian-origin stocks were estimated in the Strait of Georgia Region, with estimates of 82% to 83%. In the Queen Charlotte & Johnstone Strait Region, where the largest amount of Chinook salmon catch occurred, the Canadian proportion was estimated at 37% for bycatch occurring between September 26 to December 31, 2022, and 60% for bycatch occurring between January 1 to February 20, 2023.
• Most of the Canadian-origin Chinook salmon catch originated from the Fraser Fall 4(1), Lower Georgia Strait, and Middle Georgia Strait SMUs according to stock composition estimates (Table 8). Fraser Fall 4(1), which includes Chilliwack and Harrison Chinook CUs, was the highest proportion of catch among Canadian SMUs, representing 21% to 51% of Chinook catch within the Queen Charlotte & Johnstone Strait and Strait of Georgia Regions. Stocks of concern that 9 were represented by smaller proportions in some catch strata included Fraser Spring 4(2), Fraser Spring 5(2), Fraser Summer 5(2), and WCVI Chinook. Central Coast, Skeena, and Nass were the only northern BC SMUs detected and represented a much smaller proportion of the catch than southern BC SMUs (Table 9).
• Most Canadian-origin Chinook salmon that could be assigned to brood year using PBT belonged to the 2020 brood year, which represented 69% of the 141 PBT observations from catch occurring between September 26 and December 31, 2022 and 91% of the 226 PBT observations from catch occurring between January 1 and February 20, 2023 (Table 10).

