You are using an out of date browser. It may not display this or other websites correctly.
You should upgrade or use an alternative browser.
You should upgrade or use an alternative browser.
Saving the Fraser
- Thread starter ryanonthevedder
- Start date
ryanonthevedder
Active Member
"Recovering" is probably too strong a word but Thompson and Chilcotin steelhead have been rising off of the lows of a few years ago. https://www2.gov.bc.ca/assets/gov/e...-fraser-steelhead/ifs_fast_facts_feb_2023.pdfThe steelhead are slowly recovering? What stocks?
Sharphooks
Well-Known Member
The steelhead are slowly recovering? What stocks?
I asked myself the same question when I saw the word “recovering”…What stocks? What river system?
And yes, there is the Alaska interception problem but anyone who has been paying attention knows that gill nets in the Fraser targeting chum salmon precisely at the peak timing of the IFS steelhead return makes the whole Alaska interception bugaboo look like chump change
Those numbers are absolutely horrible and the few fish increase most likely was due.to ocean survival.
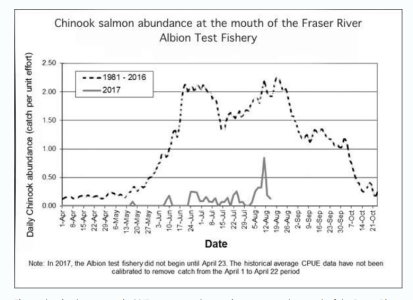
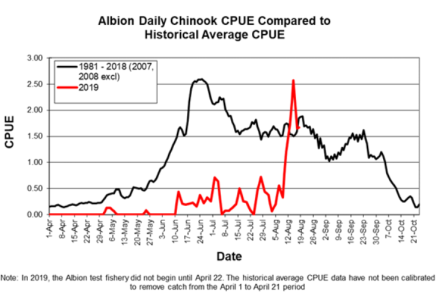
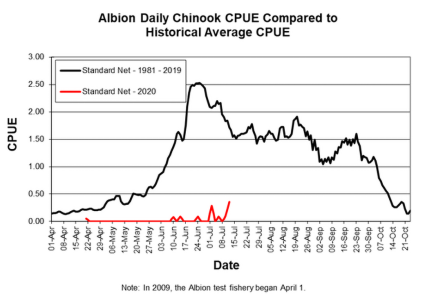
Using the albion as an indicator of stocks is at best archaic.
As long as there is nets and increasing numbers of seals in the rivers dont exepct things to get better. Habitat restoration is also a key factor that needs to be addressed on the Thompson tribs that the few steelhead come back to.
So far we are at over 25 gill and set net openings since April targetting Chinook and its only June 12. Not to mention out migrating kelts from the Thompson, Chilcotin and other Region 3 tribs.
Last edited:
wildmanyeah
Crew Member
"Recovering" is probably too strong a word but Thompson and Chilcotin steelhead have been rising off of the lows of a few years ago. https://www2.gov.bc.ca/assets/gov/e...-fraser-steelhead/ifs_fast_facts_feb_2023.pdf
Whole in the Water
Well-Known Member
Albion Test Fishery has always been a bit questionable as a truly accurate indicator, especially now that the seals have learned to use it to feast themselves on helpless gillnetted fish. 
ryanonthevedder
Active Member
I took the opportunity to fish the Thompson for Chinook last year and it was hands down the best days of red Chinook fishing I've had in fresh water.Late summer Thompson chinook stocks were good last year. Harrison White Chinook returns were also much improved. The last couple of years saw good to great coho returns in the Fraser Tribs and other LM streams.
I also remember anchoring the boat in the cottonwood saplings this time of year for a session with the bar rod in the Fraser... its been a long time since I fished in June.
I doubt any of the truly at risk stocks (salmon or steelhead) can make a recovery without some hatchery help. DFO needs to get some temporary/mobile hatchery systems in place to accelerate the process.
High Time
Crew Member
Damming the Fraser for hydro power has been on the politicians wish list for over seventy years. Let everything above the Thompson dwindle and go extinct and then give whats left below to the "special citizens". It's criminal how the fate of Fraser salmon has been mismanaged and ignored by Ottawa.
Last edited:
Mother nature did that on her own a few years ago didn't she?Imagine the Fraser system without salmon. Might as well dam it for hydro power to feed all of Trudeau's electric cars. He, like so many citiots really could give a crap about fish or anything wild.
the Province is clear it will not do that for IFS. There is a small hatchery operation in the upper river plus after the Big Bar slide early Stuart sockeye were (still done?) raised at the Inch Creek hatchery. There have been major stock crashes in the past and those that were restored were not done so via hatchery enhancement.I doubt any of the truly at risk stocks (salmon or steelhead) can make a recovery without some hatchery help. DFO needs to get some temporary/mobile hatchery systems in place to accelerate the process.
SpringVelocity
Crew Member
Saving the whales means saving the Fraser River's Chinook runs which are still grim in most cases.
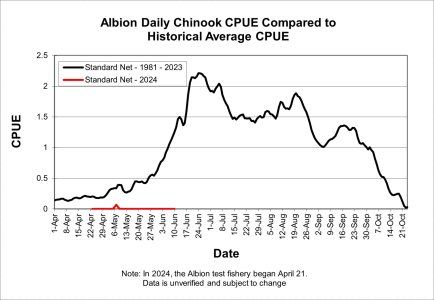
Hope for the future as the steelhead are slowly recovering with restrictions in place.
View attachment 107104
Last year was the same as what 2024 is showing. Some of early runs are still struggling, but the mid summer/fall runs are what we need to watch. Many were off the charts last year.
This graph is bit deceiving. Your better to show an average of last 5-10 years as baseline,and see what that looks like.
SpringVelocity
Crew Member
ryanonthevedder
Active Member
Last year was the same as what 2024 is showing. Some of early runs are still struggling, but the mid summer/fall runs are what we need to watch. Many were off the charts last year.
This graph is bit deceiving. Your better to show an average of last 5-10 years as baseline,and see what that looks like.
It has been 17 years since we had a real (not a slot limit) chinook opening on the Fraser River. 17 years of depressed returns. The Shuswap fish have bounced back but there's also a hatchery at Shuswap Falls where as the North Thompson fish are still off limits. I remember when those early runs were as strong as the recovered South Thompsons and want that back.
One thing to note in these next couple years is last year was this first and worse year for the big bar slide effects. Its going to be another few years before we see any positive turn around for those runs.
Fraser early stock Chinook traditionally peaked out June 21.
Currently there are only two stocks of Fraser Chinook that arent well below the long term average for brood. The South Thompson 4-1's and the Lower Fraser Fall Chinook.
Also on the South Thompson Chinook stock...last years high number was contributed to a bunch of new factors. There was a new stock assesment for Little River as well "mark recapture" being used rather than ariel survey counting.
The mark recapture was more succesful.and accurate as the visual was limited with deep water.
A very strong return for that watershed, hope it continues. Unfortunetly the ST is also the stock that has been the most heavily targetted within the Fraser the last few due the low sockeye numbers for FSC. Hopefully the stock can stable.
Hearing unconfirmed rumours of a possible bar fishery this August...
Last edited:
ryanonthevedder
Active Member
Similar threads
- Replies
- 21
- Views
- 2K
- Replies
- 7
- Views
- 1K
- Replies
- 3
- Views
- 668
- Replies
- 7
- Views
- 1K
- Replies
- 0
- Views
- 399


